|
Outlier
In statistics, an outlier is a data point that differs significantly from other observations. An outlier may be due to a variability in the measurement, an indication of novel data, or it may be the result of experimental error; the latter are sometimes excluded from the data set. An outlier can be an indication of exciting possibility, but can also cause serious problems in statistical analyses. Outliers can occur by chance in any distribution, but they can indicate novel behaviour or structures in the data-set, measurement error, or that the population has a heavy-tailed distribution. In the case of measurement error, one wishes to discard them or use statistics that are robust statistics, robust to outliers, while in the case of heavy-tailed distributions, they indicate that the distribution has high skewness and that one should be very cautious in using tools or intuitions that assume a normal distribution. A frequent cause of outliers is a mixture of two distributions, wh ... [...More Info...] [...Related Items...] OR: [Wikipedia] [Google] [Baidu] |
Robust Statistics
Robust statistics are statistics that maintain their properties even if the underlying distributional assumptions are incorrect. Robust Statistics, statistical methods have been developed for many common problems, such as estimating location parameter, location, scale parameter, scale, and regression coefficient, regression parameters. One motivation is to produce statistical methods that are not unduly affected by outliers. Another motivation is to provide methods with good performance when there are small departures from a Parametric statistics, parametric distribution. For example, robust methods work well for mixtures of two normal distributions with different standard deviations; under this model, non-robust methods like a t-test work poorly. Introduction Robust statistics seek to provide methods that emulate popular statistical methods, but are not unduly affected by outliers or other small departures from Statistical assumption, model assumptions. In statistics, classical e ... [...More Info...] [...Related Items...] OR: [Wikipedia] [Google] [Baidu] |
Box Plot
In descriptive statistics, a box plot or boxplot is a method for demonstrating graphically the locality, spread and skewness groups of numerical data through their quartiles. In addition to the box on a box plot, there can be lines (which are called ''whiskers'') extending from the box indicating variability outside the upper and lower quartiles, thus, the plot is also called the box-and-whisker plot and the box-and-whisker diagram. Outliers that differ significantly from the rest of the dataset may be plotted as individual points beyond the whiskers on the box-plot. Box plots are non-parametric: they display variation in samples of a statistical population without making any assumptions of the underlying probability distribution, statistical distribution (though Tukey's boxplot assumes symmetry for the whiskers and normality for their length). The spacings in each subsection of the box-plot indicate the degree of statistical dispersion, dispersion (spread) and skewness of the da ... [...More Info...] [...Related Items...] OR: [Wikipedia] [Google] [Baidu] |
Sample Minimum
In statistics, the sample maximum and sample minimum, also called the largest observation and smallest observation, are the values of the greatest and least elements of a sample. They are basic summary statistics, used in descriptive statistics such as the five-number summary and Bowley's seven-figure summary and the associated box plot. The minimum and the maximum value are the first and last order statistics (often denoted ''X''(1) and ''X''(''n'') respectively, for a sample size of ''n''). If the sample has outliers, they necessarily include the sample maximum or sample minimum, or both, depending on whether they are extremely high or low. However, the sample maximum and minimum need not be outliers, if they are not unusually far from other observations. Robustness The sample maximum and minimum are the ''least'' robust statistics: they are maximally sensitive to outliers. This can either be an advantage or a drawback: if extreme values are real (not measurement errors), ... [...More Info...] [...Related Items...] OR: [Wikipedia] [Google] [Baidu] |
King Effect
In statistics, economics, and econophysics, the king effect is the phenomenon in which the top one or two members of a ranked set show up as clear outliers. These top one or two members are unexpectedly large because they do not conform to the statistical distribution or rank-distribution which the remainder of the set obeys. Distributions typically followed include the power-law distribution, that is a basis for the stretched exponential function, and parabolic fractal distribution. The King effect has been observed in the distribution of: * French city sizes (where the point representing Paris is the "king", failing to conform to the stretched exponential), and similarly for other countries with a primate city, such as the United Kingdom (London), and the extreme case of Bangkok (see list of cities in Thailand). * Country populations (where only the points representing China and India fail to fit a stretched exponential). Note, however, that the king effect is not limited ... [...More Info...] [...Related Items...] OR: [Wikipedia] [Google] [Baidu] |
Estimator
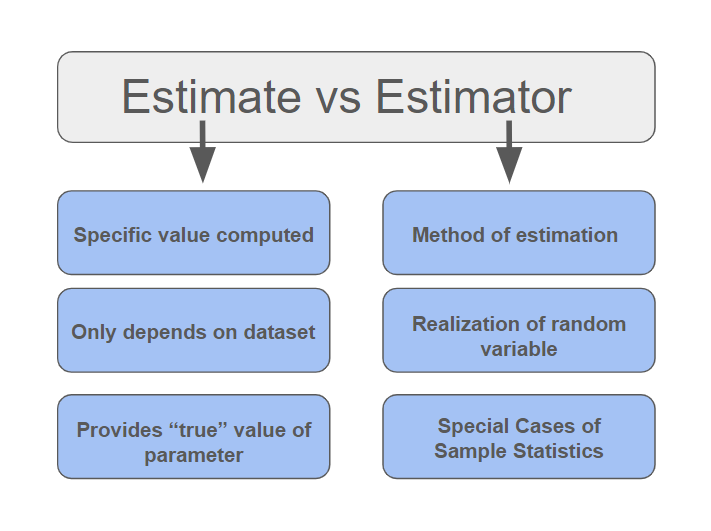
In statistics, an estimator is a rule for calculating an estimate of a given quantity based on Sample (statistics), observed data: thus the rule (the estimator), the quantity of interest (the estimand) and its result (the estimate) are distinguished. For example, the sample mean is a commonly used estimator of the population mean. There are point estimator, point and interval estimators. The point estimators yield single-valued results. This is in contrast to an interval estimator, where the result would be a range of plausible values. "Single value" does not necessarily mean "single number", but includes vector valued or function valued estimators. ''Estimation theory'' is concerned with the properties of estimators; that is, with defining properties that can be used to compare different estimators (different rules for creating estimates) for the same quantity, based on the same data. Such properties can be used to determine the best rules to use under given circumstances. Howeve ... [...More Info...] [...Related Items...] OR: [Wikipedia] [Google] [Baidu] |
Skewness
In probability theory and statistics, skewness is a measure of the asymmetry of the probability distribution of a real-valued random variable about its mean. The skewness value can be positive, zero, negative, or undefined. For a unimodal distribution (a distribution with a single peak), negative skew commonly indicates that the ''tail'' is on the left side of the distribution, and positive skew indicates that the tail is on the right. In cases where one tail is long but the other tail is fat, skewness does not obey a simple rule. For example, a zero value in skewness means that the tails on both sides of the mean balance out overall; this is the case for a symmetric distribution but can also be true for an asymmetric distribution where one tail is long and thin, and the other is short but fat. Thus, the judgement on the symmetry of a given distribution by using only its skewness is risky; the distribution shape must be taken into account. Introduction Consider the two d ... [...More Info...] [...Related Items...] OR: [Wikipedia] [Google] [Baidu] |
Standard Deviation
In statistics, the standard deviation is a measure of the amount of variation of the values of a variable about its Expected value, mean. A low standard Deviation (statistics), deviation indicates that the values tend to be close to the mean (also called the expected value) of the set, while a high standard deviation indicates that the values are spread out over a wider range. The standard deviation is commonly used in the determination of what constitutes an outlier and what does not. Standard deviation may be abbreviated SD or std dev, and is most commonly represented in mathematical texts and equations by the lowercase Greek alphabet, Greek letter Sigma, σ (sigma), for the population standard deviation, or the Latin script, Latin letter ''s'', for the sample standard deviation. The standard deviation of a random variable, Sample (statistics), sample, statistical population, data set, or probability distribution is the square root of its variance. (For a finite population, v ... [...More Info...] [...Related Items...] OR: [Wikipedia] [Google] [Baidu] |
Arithmetic Mean
In mathematics and statistics, the arithmetic mean ( ), arithmetic average, or just the ''mean'' or ''average'' is the sum of a collection of numbers divided by the count of numbers in the collection. The collection is often a set of results from an experiment, an observational study, or a Survey (statistics), survey. The term "arithmetic mean" is preferred in some contexts in mathematics and statistics because it helps to distinguish it from other types of means, such as geometric mean, geometric and harmonic mean, harmonic. Arithmetic means are also frequently used in economics, anthropology, history, and almost every other academic field to some extent. For example, per capita income is the arithmetic average of the income of a nation's Human population, population. While the arithmetic mean is often used to report central tendency, central tendencies, it is not a robust statistic: it is greatly influenced by outliers (Value (mathematics), values much larger or smaller than ... [...More Info...] [...Related Items...] OR: [Wikipedia] [Google] [Baidu] |
Mixture Model
In statistics, a mixture model is a probabilistic model for representing the presence of subpopulations within an overall population, without requiring that an observed data set should identify the sub-population to which an individual observation belongs. Formally a mixture model corresponds to the mixture distribution that represents the probability distribution of observations in the overall population. However, while problems associated with "mixture distributions" relate to deriving the properties of the overall population from those of the sub-populations, "mixture models" are used to make statistical inferences about the properties of the sub-populations given only observations on the pooled population, without sub-population identity information. Mixture models are used for clustering, under the name model-based clustering, and also for density estimation. Mixture models should not be confused with models for compositional data, i.e., data whose components are constra ... [...More Info...] [...Related Items...] OR: [Wikipedia] [Google] [Baidu] |
Normal Distribution
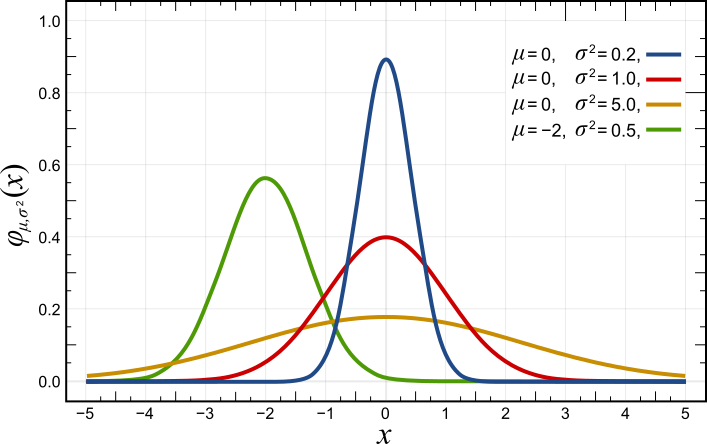
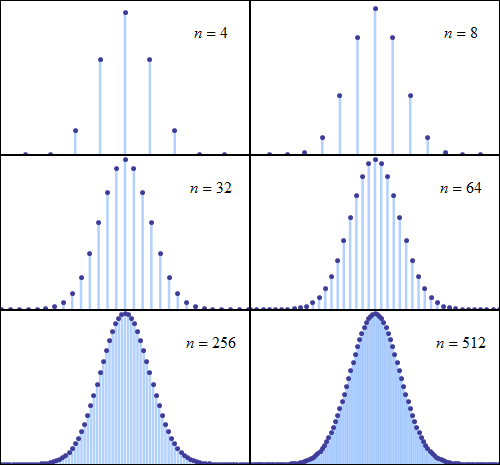
In probability theory and statistics, a normal distribution or Gaussian distribution is a type of continuous probability distribution for a real-valued random variable. The general form of its probability density function is f(x) = \frac e^\,. The parameter is the mean or expectation of the distribution (and also its median and mode), while the parameter \sigma^2 is the variance. The standard deviation of the distribution is (sigma). A random variable with a Gaussian distribution is said to be normally distributed, and is called a normal deviate. Normal distributions are important in statistics and are often used in the natural and social sciences to represent real-valued random variables whose distributions are not known. Their importance is partly due to the central limit theorem. It states that, under some conditions, the average of many samples (observations) of a random variable with finite mean and variance is itself a random variable—whose distribution c ... [...More Info...] [...Related Items...] OR: [Wikipedia] [Google] [Baidu] |
Normal Probability Plot
The normal probability plot is a graphical technique to identify substantive departures from normality. This includes identifying outliers, skewness, kurtosis, a need for transformations, and mixtures. Normal probability plots are made of raw data, residuals from model fits, and estimated parameters. In a normal probability plot (also called a "normal plot"), the sorted data are plotted vs. values selected to make the resulting image look close to a straight line if the data are approximately normally distributed. Deviations from a straight line suggest departures from normality. The plotting can be manually performed by using a special graph paper, called ''normal probability paper''. With modern computers normal plots are commonly made with software. The normal probability plot is a special case of the Q–Q probability plot for a normal distribution. The theoretical quantiles are generally chosen to approximate either the mean or the median of the corresponding order ... [...More Info...] [...Related Items...] OR: [Wikipedia] [Google] [Baidu] |


