|
Projection Pursuit
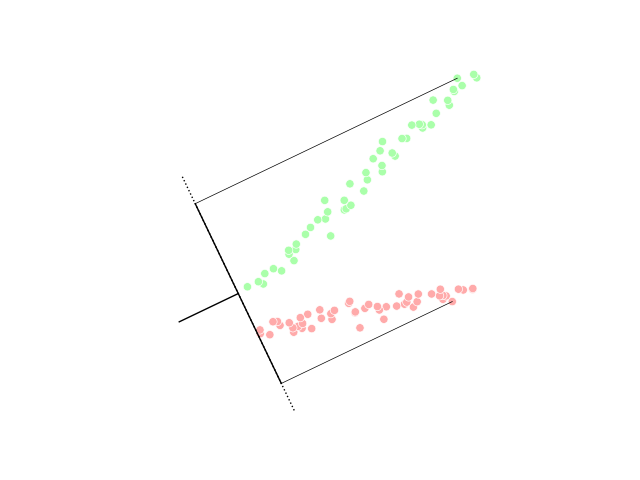
Projection pursuit (PP) is a type of statistical technique that involves finding the most "interesting" possible projections in multidimensional data. Often, projections that deviate more from a normal distribution are considered to be more interesting. As each projection is found, the data are reduced by removing the component along that projection, and the process is repeated to find new projections; this is the "pursuit" aspect that motivated the technique known as matching pursuit. The idea of projection pursuit is to locate the projection or projections from high-dimensional space to low-dimensional space that reveal the most details about the structure of the data set. Once an interesting set of projections has been found, existing structures (clusters, surfaces, etc.) can be extracted and analyzed separately. Projection pursuit has been widely used for blind source separation, so it is very important in independent component analysis. Projection pursuit seeks one projec ... [...More Info...] [...Related Items...] OR: [Wikipedia] [Google] [Baidu] |
Projection (linear Algebra)
In linear algebra and functional analysis, a projection is a linear transformation P from a vector space to itself (an endomorphism) such that P\circ P=P. That is, whenever P is applied twice to any vector, it gives the same result as if it were applied once (i.e. P is idempotent). It leaves its image unchanged. This definition of "projection" formalizes and generalizes the idea of graphical projection. One can also consider the effect of a projection on a geometrical object by examining the effect of the projection on points in the object. Definitions A projection on a vector space V is a linear operator P\colon V \to V such that P^2 = P. When V has an inner product and is complete, i.e. when V is a Hilbert space, the concept of orthogonality can be used. A projection P on a Hilbert space V is called an orthogonal projection if it satisfies \langle P \mathbf x, \mathbf y \rangle = \langle \mathbf x, P \mathbf y \rangle for all \mathbf x, \mathbf y \in V. A projecti ... [...More Info...] [...Related Items...] OR: [Wikipedia] [Google] [Baidu] |
Normal Distribution
In probability theory and statistics, a normal distribution or Gaussian distribution is a type of continuous probability distribution for a real-valued random variable. The general form of its probability density function is f(x) = \frac e^\,. The parameter is the mean or expectation of the distribution (and also its median and mode), while the parameter \sigma^2 is the variance. The standard deviation of the distribution is (sigma). A random variable with a Gaussian distribution is said to be normally distributed, and is called a normal deviate. Normal distributions are important in statistics and are often used in the natural and social sciences to represent real-valued random variables whose distributions are not known. Their importance is partly due to the central limit theorem. It states that, under some conditions, the average of many samples (observations) of a random variable with finite mean and variance is itself a random variable—whose distribution c ... [...More Info...] [...Related Items...] OR: [Wikipedia] [Google] [Baidu] |
Matching Pursuit
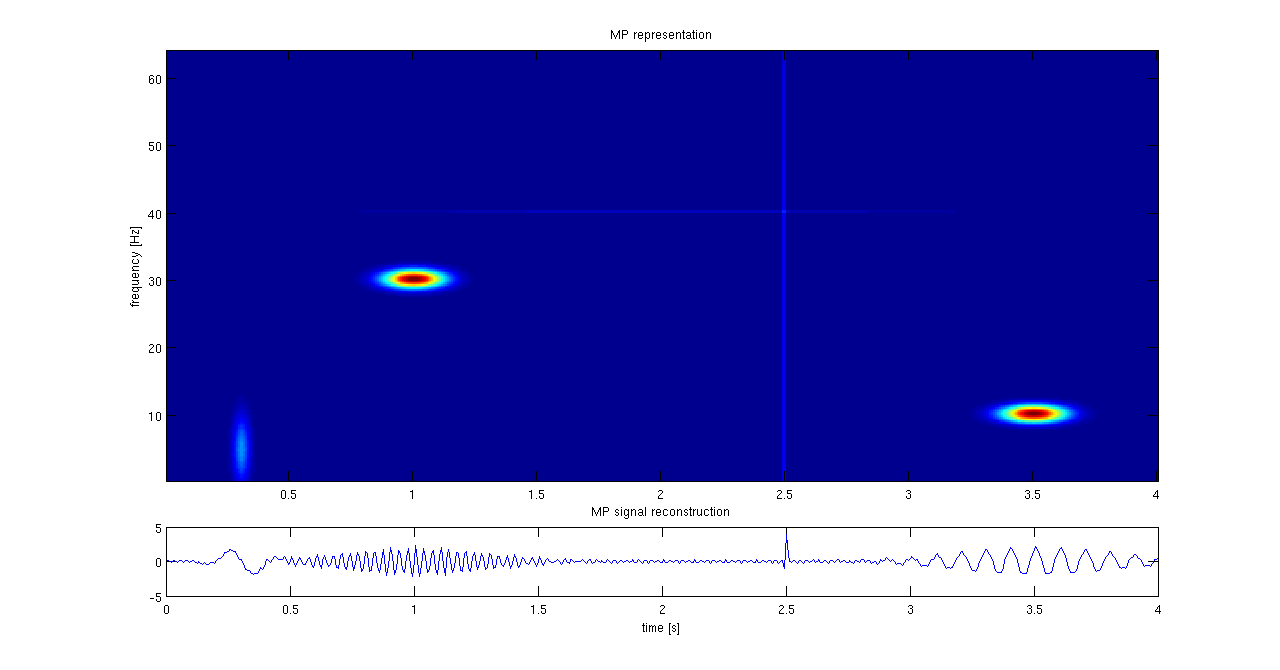
Matching pursuit (MP) is a sparse approximation algorithm which finds the "best matching" projections of multidimensional data onto the span of an over-complete (i.e., redundant) dictionary D. The basic idea is to approximately represent a signal f from Hilbert space H as a weighted sum of finitely many functions g_ (called atoms) taken from D. An approximation with N atoms has the form : f(t) \approx \hat f_N(t) := \sum_^ a_n g_(t) where g_ is the \gamma_nth column of the matrix D and a_n is the scalar weighting factor (amplitude) for the atom g_. Normally, not every atom in D will be used in this sum. Instead, matching pursuit chooses the atoms one at a time in order to maximally (greedily) reduce the approximation error. This is achieved by finding the atom that has the highest inner product with the signal (assuming the atoms are normalized), subtracting from the signal an approximation that uses only that one atom, and repeating the process until the signal is satisfactoril ... [...More Info...] [...Related Items...] OR: [Wikipedia] [Google] [Baidu] |
High-dimensional Space
In physics and mathematics, the dimension of a mathematical space (or object) is informally defined as the minimum number of coordinates needed to specify any point within it. Thus, a line has a dimension of one (1D) because only one coordinate is needed to specify a point on itfor example, the point at 5 on a number line. A surface, such as the boundary of a cylinder or sphere, has a dimension of two (2D) because two coordinates are needed to specify a point on itfor example, both a latitude and longitude are required to locate a point on the surface of a sphere. A two-dimensional Euclidean space is a two-dimensional space on the plane. The inside of a cube, a cylinder or a sphere is three-dimensional (3D) because three coordinates are needed to locate a point within these spaces. In classical mechanics, space and time are different categories and refer to absolute space and time. That conception of the world is a four-dimensional space but not the one that was found nec ... [...More Info...] [...Related Items...] OR: [Wikipedia] [Google] [Baidu] |
Blind Source Separation
Source separation, blind signal separation (BSS) or blind source separation, is the separation of a set of source signals from a set of mixed signals, without the aid of information (or with very little information) about the source signals or the mixing process. It is most commonly applied in digital signal processing and involves the analysis of mixtures of signals; the objective is to recover the original component signals from a mixture signal. The classical example of a source separation problem is the cocktail party problem, where a number of people are talking simultaneously in a room (for example, at a cocktail party), and a listener is trying to follow one of the discussions. The human brain can handle this sort of auditory source separation problem, but it is a difficult problem in digital signal processing. This problem is in general highly underdetermined, but useful solutions can be derived under a surprising variety of conditions. Much of the early literature in th ... [...More Info...] [...Related Items...] OR: [Wikipedia] [Google] [Baidu] |
Independent Component Analysis
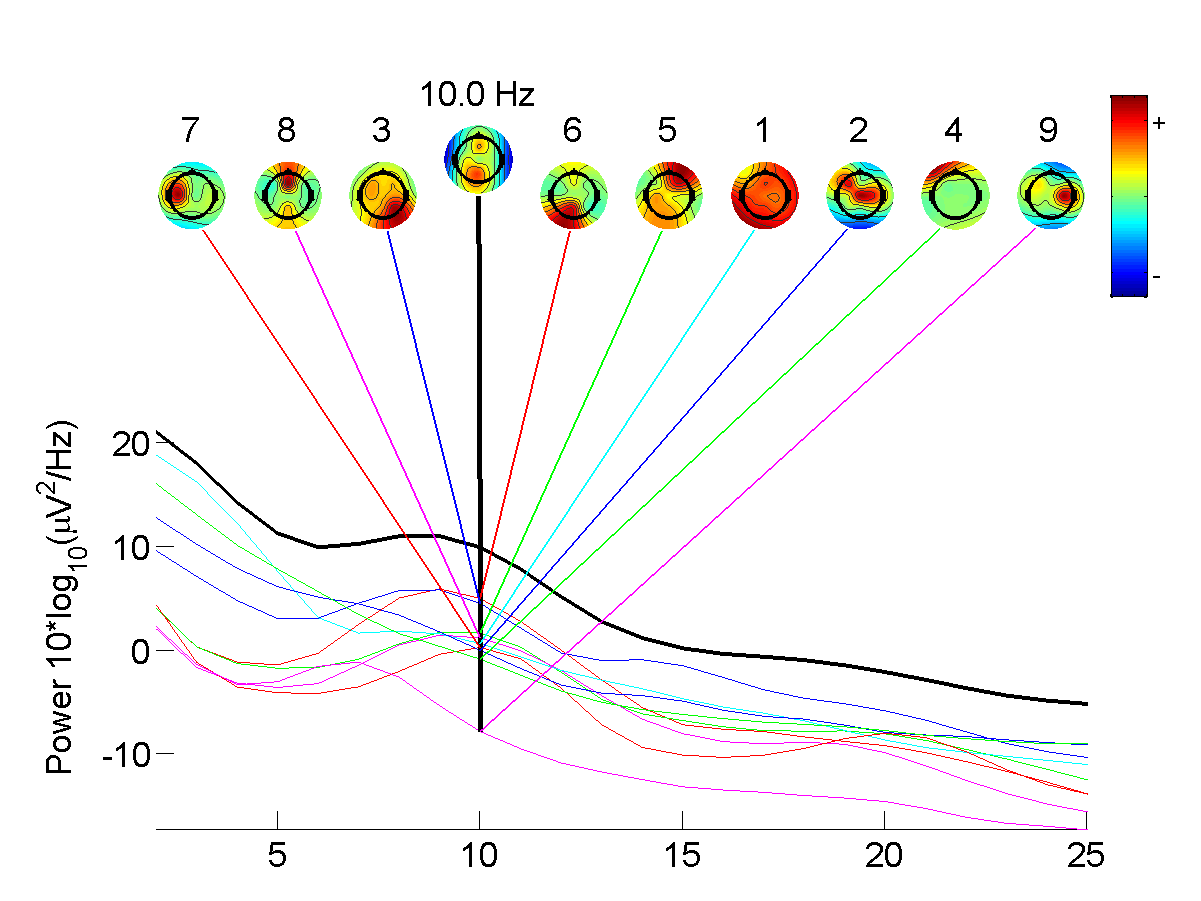
In signal processing, independent component analysis (ICA) is a computational method for separating a multivariate statistics, multivariate signal into additive subcomponents. This is done by assuming that at most one subcomponent is Gaussian and that the subcomponents are Statistical independence, statistically independent from each other. ICA was invented by Jeanny Hérault and Christian Jutten in 1985. ICA is a special case of blind source separation. A common example application of ICA is the "cocktail party problem" of listening in on one person's speech in a noisy room. Introduction Independent component analysis attempts to decompose a multivariate signal into independent non-Gaussian signals. As an example, sound is usually a signal that is composed of the numerical addition, at each time t, of signals from several sources. The question then is whether it is possible to separate these contributing sources from the observed total signal. When the statistical independence ... [...More Info...] [...Related Items...] OR: [Wikipedia] [Google] [Baidu] |
Jerome H
Jerome (; ; ; – 30 September 420), also known as Jerome of Stridon, was an early Christian presbyter, priest, Confessor of the Faith, confessor, theologian, translator, and historian; he is commonly known as Saint Jerome. He is best known for his translation of the Bible into Latin (the translation that became known as the Vulgate) and his commentaries on the whole Bible. Jerome attempted to create a translation of the Old Testament based on a Hebrew version, rather than the Septuagint, as Vetus Latina, prior Latin Bible translations had done. His list of writings is extensive. In addition to his biblical works, he wrote polemical and historical essays, always from a theologian's perspective. Jerome was known for his teachings on Christian moral life, especially those in cosmopolitan centers such as Rome. He often focused on women's lives and identified how a woman devoted to Jesus should live her life. This focus stemmed from his close patron relationships with several pro ... [...More Info...] [...Related Items...] OR: [Wikipedia] [Google] [Baidu] |
John Tukey
John Wilder Tukey (; June 16, 1915 – July 26, 2000) was an American mathematician and statistician, best known for the development of the fast Fourier Transform (FFT) algorithm and box plot. The Tukey range test, the Tukey lambda distribution, the Tukey test of additivity, and the Teichmüller–Tukey lemma all bear his name. He is also credited with coining the term '' bit'' and the first published use of the word ''software''. Biography Tukey was born in New Bedford, Massachusetts, in 1915, to a Latin teacher father and a private tutor. He was mainly taught by his mother and attended regular classes only for certain subjects like French. Tukey obtained a B.A. in 1936 and M.S. in 1937 in chemistry, from Brown University, before moving to Princeton University, where in 1939 he received a PhD in mathematics after completing a doctoral dissertation titled "On denumerability in topology". During World War II, Tukey worked at the Fire Control Research Office and coll ... [...More Info...] [...Related Items...] OR: [Wikipedia] [Google] [Baidu] |
Curse Of Dimensionality
The curse of dimensionality refers to various phenomena that arise when analyzing and organizing data in high-dimensional spaces that do not occur in low-dimensional settings such as the three-dimensional physical space of everyday experience. The expression was coined by Richard E. Bellman when considering problems in dynamic programming. The curse generally refers to issues that arise when the number of datapoints is small (in a suitably defined sense) relative to the intrinsic dimension of the data. Dimensionally cursed phenomena occur in domains such as numerical analysis, sampling, combinatorics, machine learning, data mining and databases. The common theme of these problems is that when the dimensionality increases, the volume of the space increases so fast that the available data become sparse. In order to obtain a reliable result, the amount of data needed often grows exponentially with the dimensionality. Also, organizing and searching data often relies on detecting a ... [...More Info...] [...Related Items...] OR: [Wikipedia] [Google] [Baidu] |
Principal Component Analysis
Principal component analysis (PCA) is a linear dimensionality reduction technique with applications in exploratory data analysis, visualization and data preprocessing. The data is linearly transformed onto a new coordinate system such that the directions (principal components) capturing the largest variation in the data can be easily identified. The principal components of a collection of points in a real coordinate space are a sequence of p unit vectors, where the i-th vector is the direction of a line that best fits the data while being orthogonal to the first i-1 vectors. Here, a best-fitting line is defined as one that minimizes the average squared perpendicular distance from the points to the line. These directions (i.e., principal components) constitute an orthonormal basis in which different individual dimensions of the data are linearly uncorrelated. Many studies use the first two principal components in order to plot the data in two dimensions and to visually identi ... [...More Info...] [...Related Items...] OR: [Wikipedia] [Google] [Baidu] |
Discriminant Analysis
Linear discriminant analysis (LDA), normal discriminant analysis (NDA), canonical variates analysis (CVA), or discriminant function analysis is a generalization of Fisher's linear discriminant, a method used in statistics and other fields, to find a linear combination of features that characterizes or separates two or more classes of objects or events. The resulting combination may be used as a linear classifier, or, more commonly, for dimensionality reduction before later statistical classification, classification. LDA is closely related to analysis of variance (ANOVA) and regression analysis, which also attempt to express one dependent variable as a linear combination of other features or measurements. However, ANOVA uses categorical variable, categorical independent variables and a continuous variable, continuous dependent variable, whereas discriminant analysis has continuous independent variables and a categorical dependent variable (''i.e.'' the class label). Logistic regr ... [...More Info...] [...Related Items...] OR: [Wikipedia] [Google] [Baidu] |


