|
Stage (hydrology)
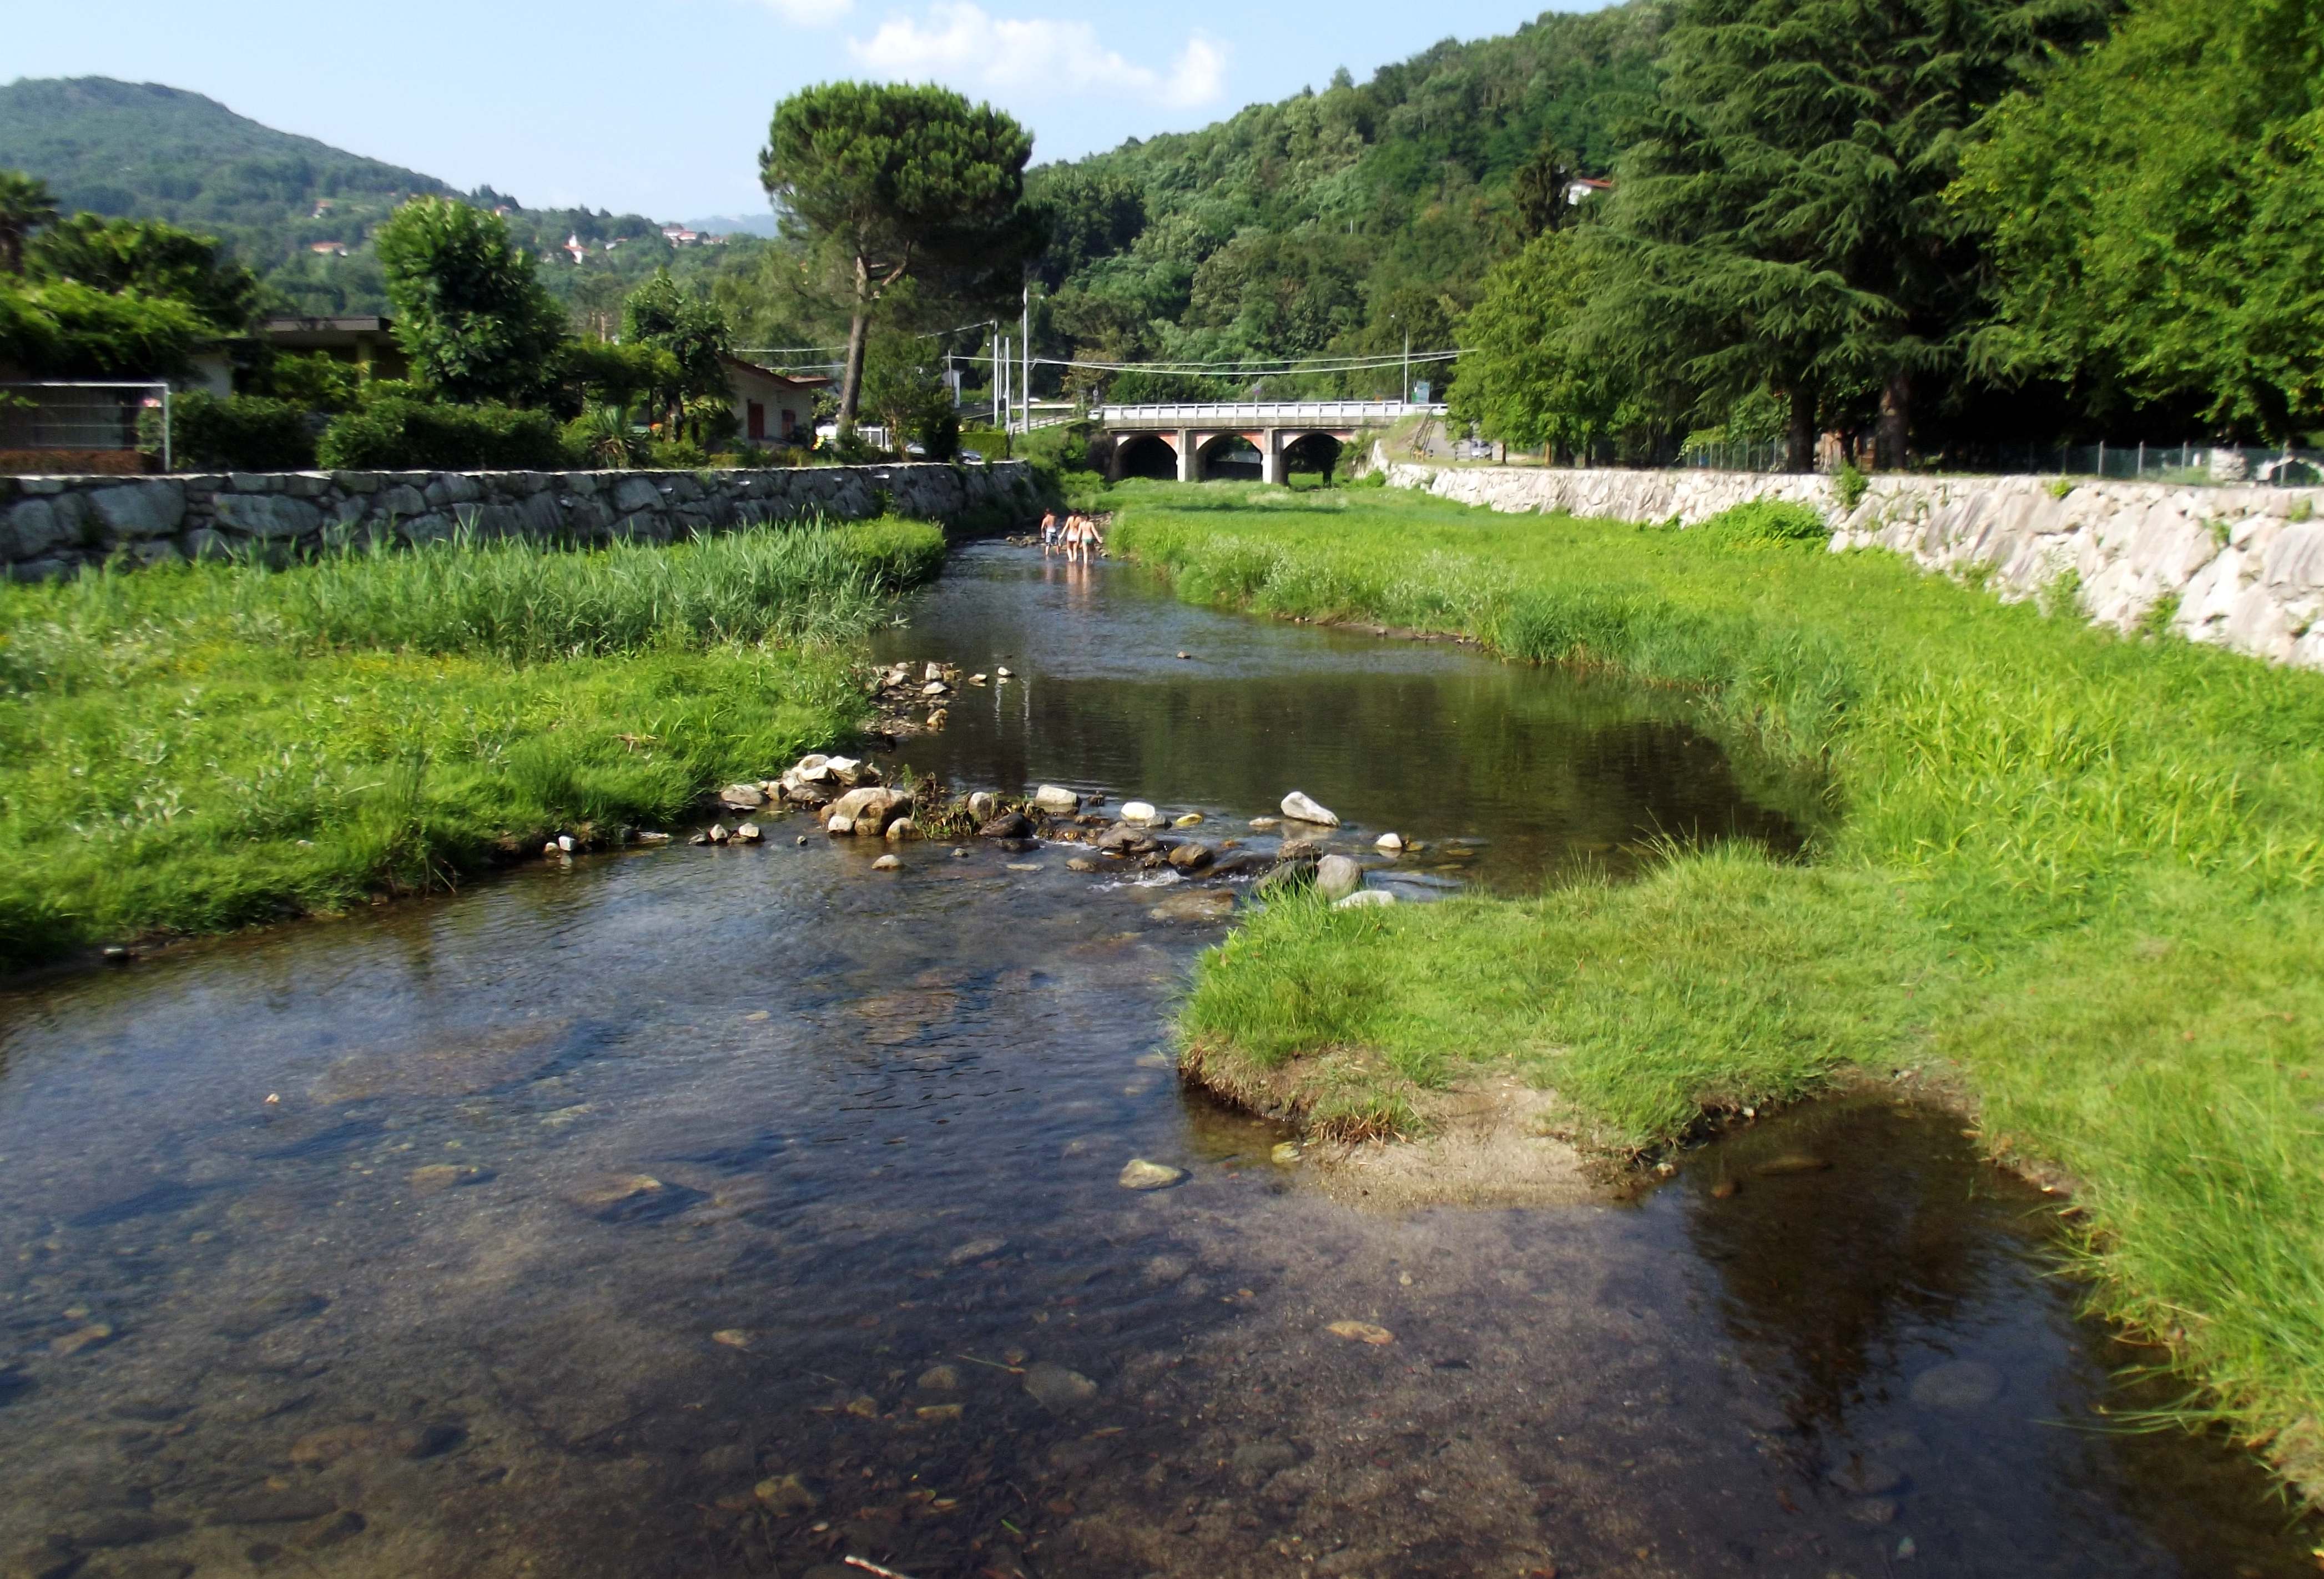
In hydrology, stage is the water level in a river or stream with respect to a chosen reference height. It is commonly measured in units of feet. Stage is important because direct measurements of river discharge are very difficult while water surface elevation measurements are comparatively easy. In order to convert stage into discharge, a ''rating curve'' is needed. Hydrologists can use a combination of tracer studies, observations of high water marks, numerical modeling, and/or satellite or aerial photography. See also * Chart datum * Hydraulic head * Stream gauge A stream gauge, streamgage or stream gauging station is a location used by hydrologists or environmental scientists to monitor and test terrestrial bodies of water. Hydrometric measurements of water level surface elevation (" stage") and/or v ... References Hydrology Vertical position {{geo-term-stub ... [...More Info...] [...Related Items...] OR: [Wikipedia] [Google] [Baidu] |
Hydrology
Hydrology () is the scientific study of the movement, distribution, and management of water on Earth and other planets, including the water cycle, water resources, and drainage basin sustainability. A practitioner of hydrology is called a hydrologist. Hydrologists are scientists studying earth science, earth or environmental science, civil engineering, civil or environmental engineering, and physical geography. Using various analytical methods and scientific techniques, they collect and analyze data to help solve water related problems such as Environmentalism, environmental preservation, natural disasters, and Water resource management, water management. Hydrology subdivides into surface water hydrology, groundwater hydrology (hydrogeology), and marine hydrology. Domains of hydrology include hydrometeorology, surface-water hydrology, surface hydrology, hydrogeology, drainage basin, drainage-basin management, and water quality. Oceanography and meteorology are not included beca ... [...More Info...] [...Related Items...] OR: [Wikipedia] [Google] [Baidu] |
High Water Mark
A high water mark is a point that represents the maximum rise of a body of water over land. Such a mark is often the result of a flood, but high water marks may reflect an all-time high, an annual high (highest level to which water rose that year) or the high point for some other division of time. Knowledge of the high water mark for an area is useful in managing the development of that area, particularly in making preparations for flood surges. High water marks from floods have been measured for planning purposes since at least as far back as the civilizations of ancient Egypt. It is a common practice to create a physical marker indicating one or more of the highest water marks for an area, usually with a line at the level to which the water rose, and a notation of the date on which this high water mark was set. This may be a free-standing flood level Information sign, sign or other marker, or it may be affixed to a building or other structure that was standing at the time o ... [...More Info...] [...Related Items...] OR: [Wikipedia] [Google] [Baidu] |
Stream Gauge
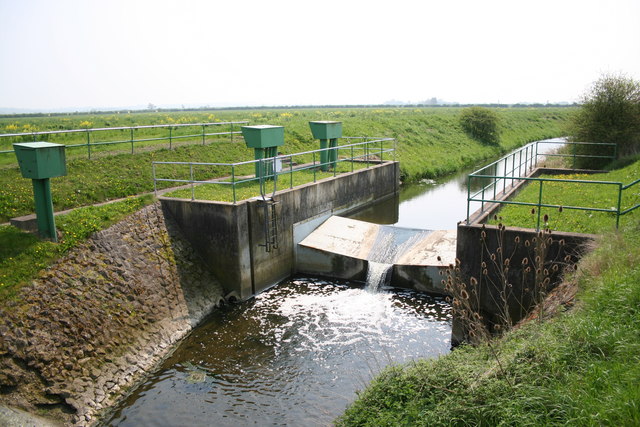
A stream gauge, streamgage or stream gauging station is a location used by hydrologists or environmental scientists to monitor and test terrestrial bodies of water. Hydrometric measurements of water level surface elevation (" stage") and/or volumetric discharge (flow) are generally taken and observations of biota and water quality may also be made. The locations of gauging stations are often found on topographical maps. Some gauging stations are highly automated and may include telemetry capability transmitted to a central data logging facility. Measurement equipment Automated direct measurement of stream discharge is difficult at present. Mathematically, measuring stream discharge is estimating the volumetric flow rate, which is in general a flux integral and thus requires many cross-sectional velocity measurements. In place of the direct measurement of stream discharge, one or more surrogate measurements can be used as proxy variables to produce discharge values. I ... [...More Info...] [...Related Items...] OR: [Wikipedia] [Google] [Baidu] |
Hydraulic Head
Hydraulic head or piezometric head is a measurement related to liquid pressure (normalized by specific weight) and the liquid elevation above a vertical datum., 410 pages. See pp. 43–44., 650 pages. See p. 22, eq.3.2a. It is usually measured as an equivalent liquid surface elevation, expressed in units of length, at the entrance (or bottom) of a piezometer. In an aquifer, it can be calculated from the depth to water in a piezometric well (a specialized water well), and given information of the piezometer's elevation and screen depth. Hydraulic head can similarly be measured in a column of water using a standpipe piezometer by measuring the height of the water surface in the tube relative to a common datum. The hydraulic head can be used to determine a ''hydraulic gradient'' between two or more points. Definition In fluid dynamics, the ''head'' at some point in an incompressible (constant density) flow is equal to the height of a static column of fluid whose pressure at ... [...More Info...] [...Related Items...] OR: [Wikipedia] [Google] [Baidu] |
Chart Datum
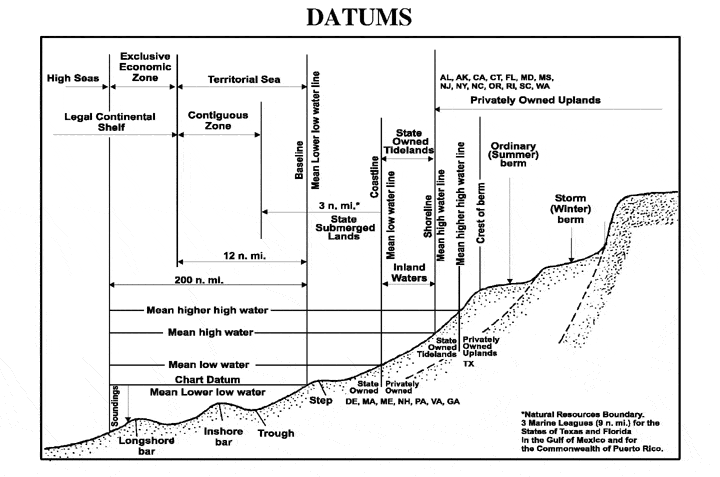
A chart datum is the water surface serving as origin (or coordinate surface) of depths displayed on a nautical chart and for reporting and predicting tide heights. A chart datum is generally derived from some tidal phase, in which case it is also known as a tidal datum. Common chart datums are ''lowest astronomical tide'' (LAT)Australian Bureau of MeteorologNational Tide Centre Glossary(retrieved 30 April 2013) and ''mean lower low water'' (MLLW). In non-tidal areas, e.g. the Baltic Sea, mean sea level (MSL) is used. A chart datum is a type of vertical datum and must not be confused with the horizontal datum for the chart. However, it is necessarily an equigeopotential (a water "level surface"): the chart datum is tilted across smaller to larger tidal range regions; in rivers, it is a sloping and undulating surface following the low stage. Definitions The following tidal phases are commonly used in the definition of chart datums. Lowest and highest astronomical tide ... [...More Info...] [...Related Items...] OR: [Wikipedia] [Google] [Baidu] |
Aerial Photography
Aerial photography (or airborne imagery) is the taking of photographs from an aircraft or other flight, airborne platforms. When taking motion pictures, it is also known as aerial videography. Platforms for aerial photography include fixed-wing aircraft, helicopters, unmanned aerial vehicles (UAVs or "drones"), balloon (aircraft), balloons, blimps and dirigibles, rockets, pigeon photography, pigeons, kite aerial photography, kites, or using action cameras while skydiving or wingsuiting. Handheld cameras may be manually operated by the photographer, while mounted cameras are usually remote operation, remotely operated or triggered automatically. Aerial photography typically refers specifically to bird's-eye view images that focus on landscapes and Earth surface, surface objects, and should not be confused with air-to-air photography, where one or more aircraft are used as chase planes that "chase" and photograph other aircraft in flight. Elevated photography can also produce b ... [...More Info...] [...Related Items...] OR: [Wikipedia] [Google] [Baidu] |
Satellite Photography
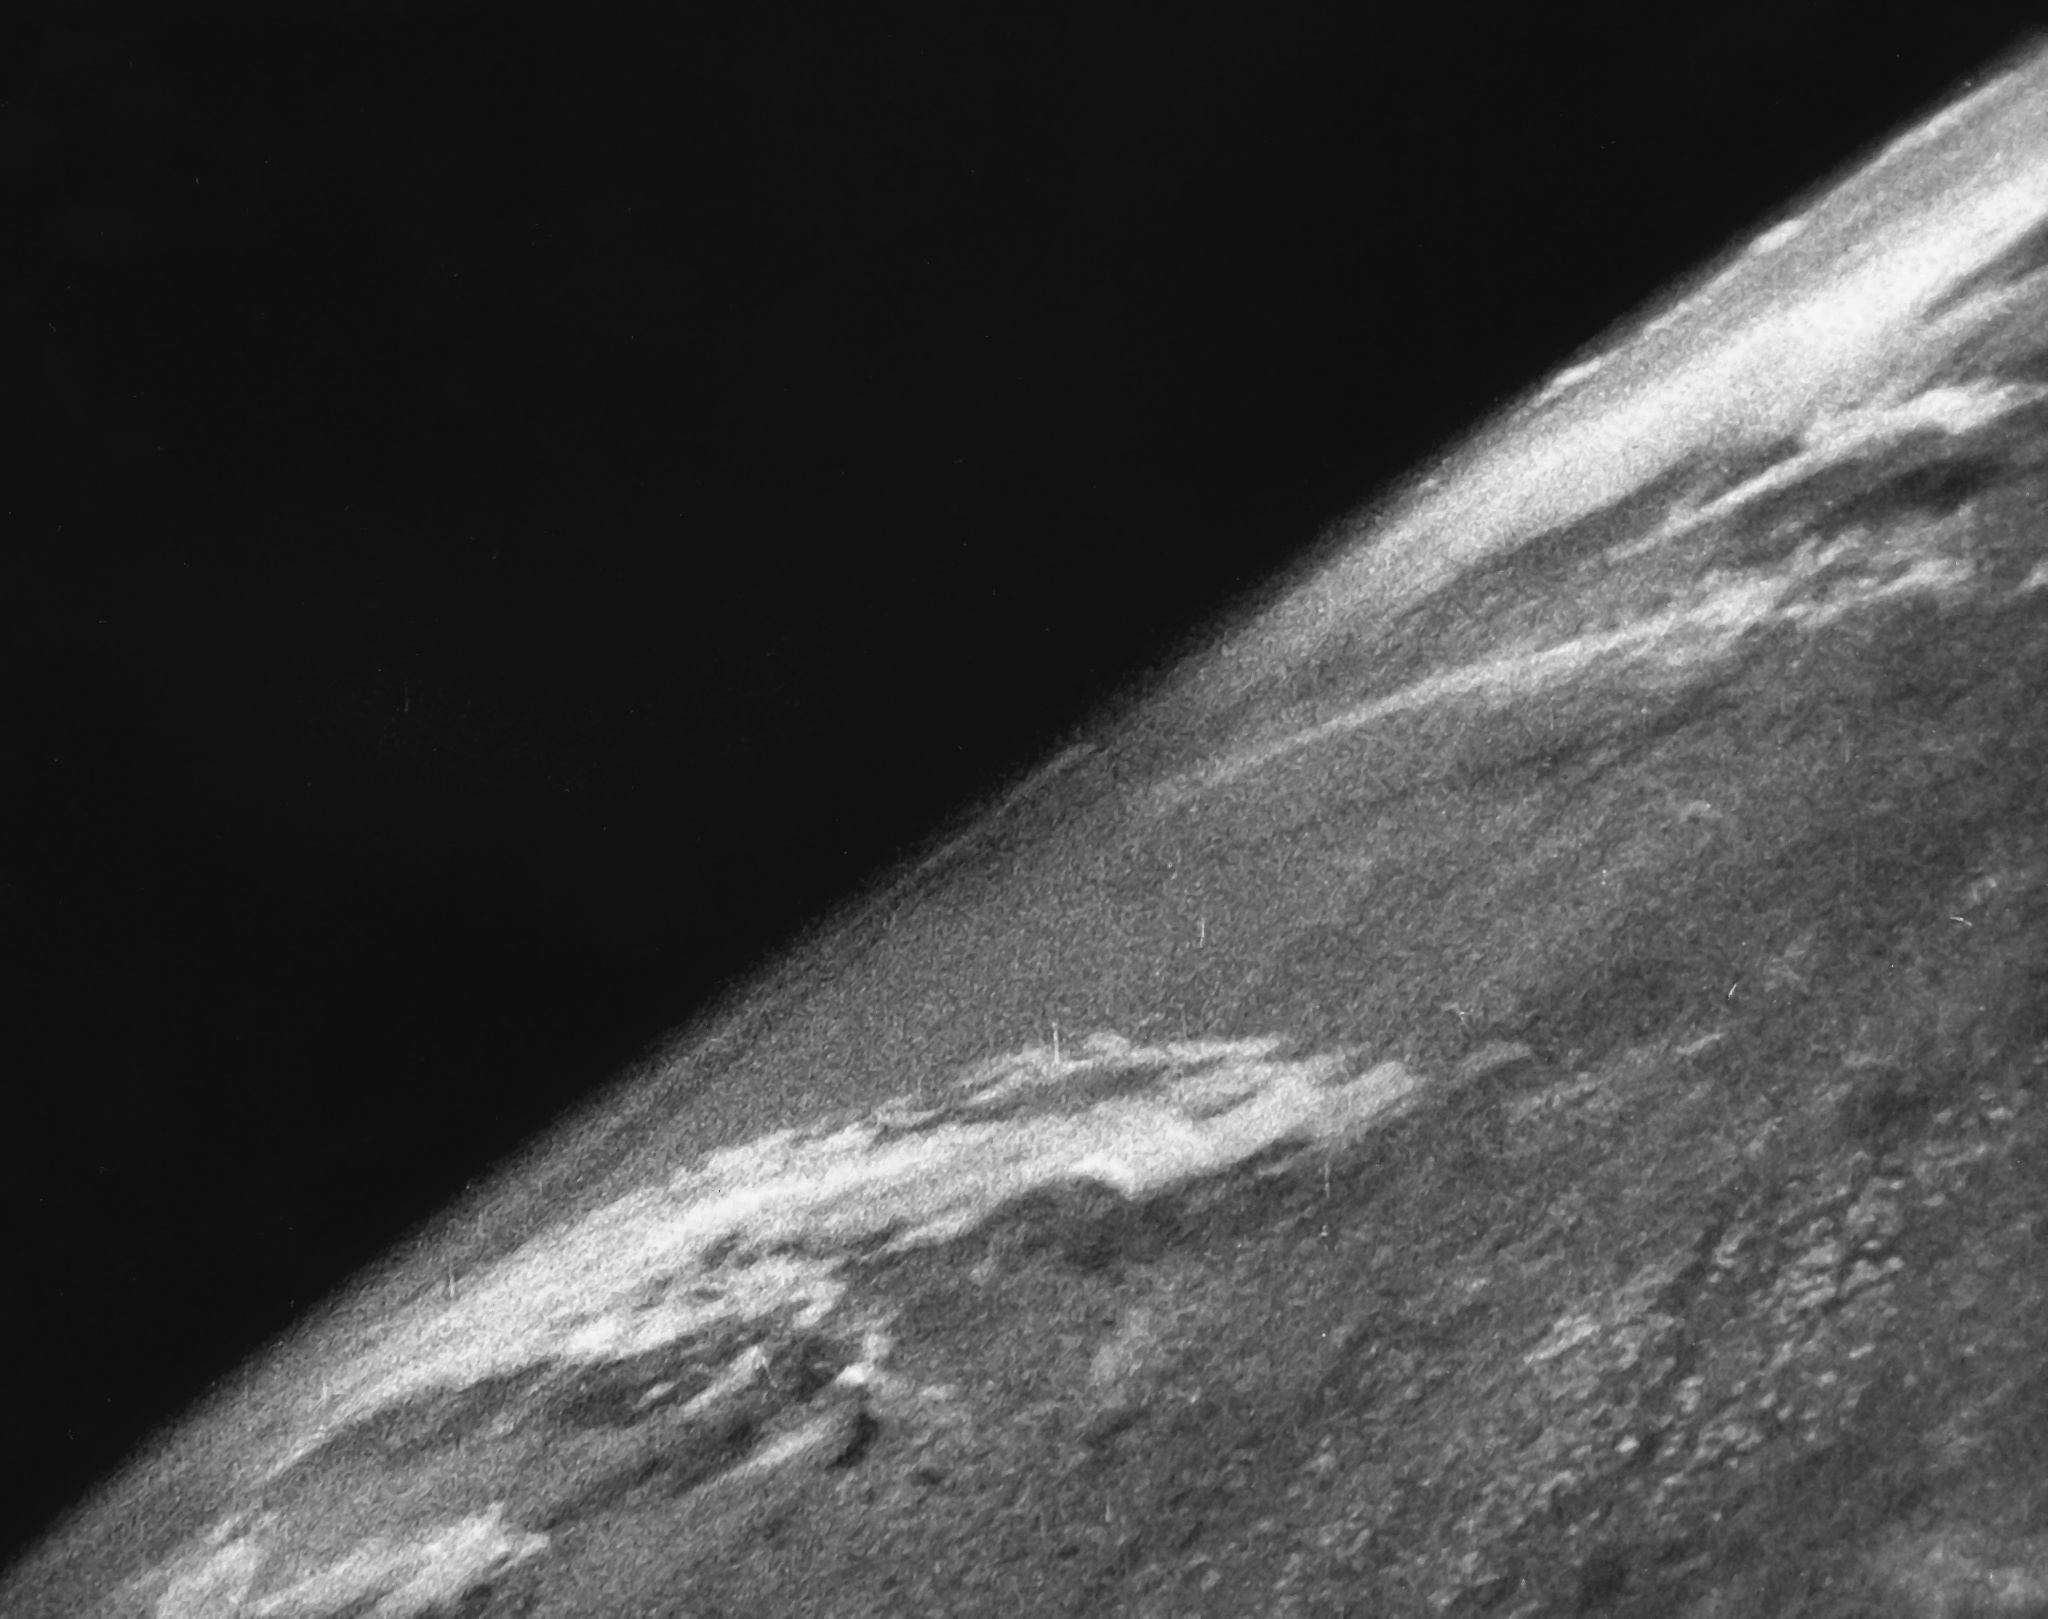
Satellite images (also Earth observation imagery, spaceborne photography, or simply satellite photo) are images of Earth collected by imaging satellites operated by governments and businesses around the world. Satellite imaging companies sell images by licensing them to governments and businesses such as Apple Maps and Google Maps. History The first images from space were taken on sub-orbital flights. The US-launched V-2 flight on October 24, 1946, took one image every 1.5 seconds. With an apogee of 65 miles (105 km), these photos were from five times higher than the previous record, the 13.7 miles (22 km) by the Explorer II balloon mission in 1935. The first satellite (orbital) photographs of Earth were made on August 14, 1959, by the U.S. Explorer 6. The first satellite photographs of the Moon might have been made on October 6, 1959, by the Soviet satellite Luna 3, on a mission to photograph the far side of the Moon. The Blue Marble photograph was taken from sp ... [...More Info...] [...Related Items...] OR: [Wikipedia] [Google] [Baidu] |
Numerical Model
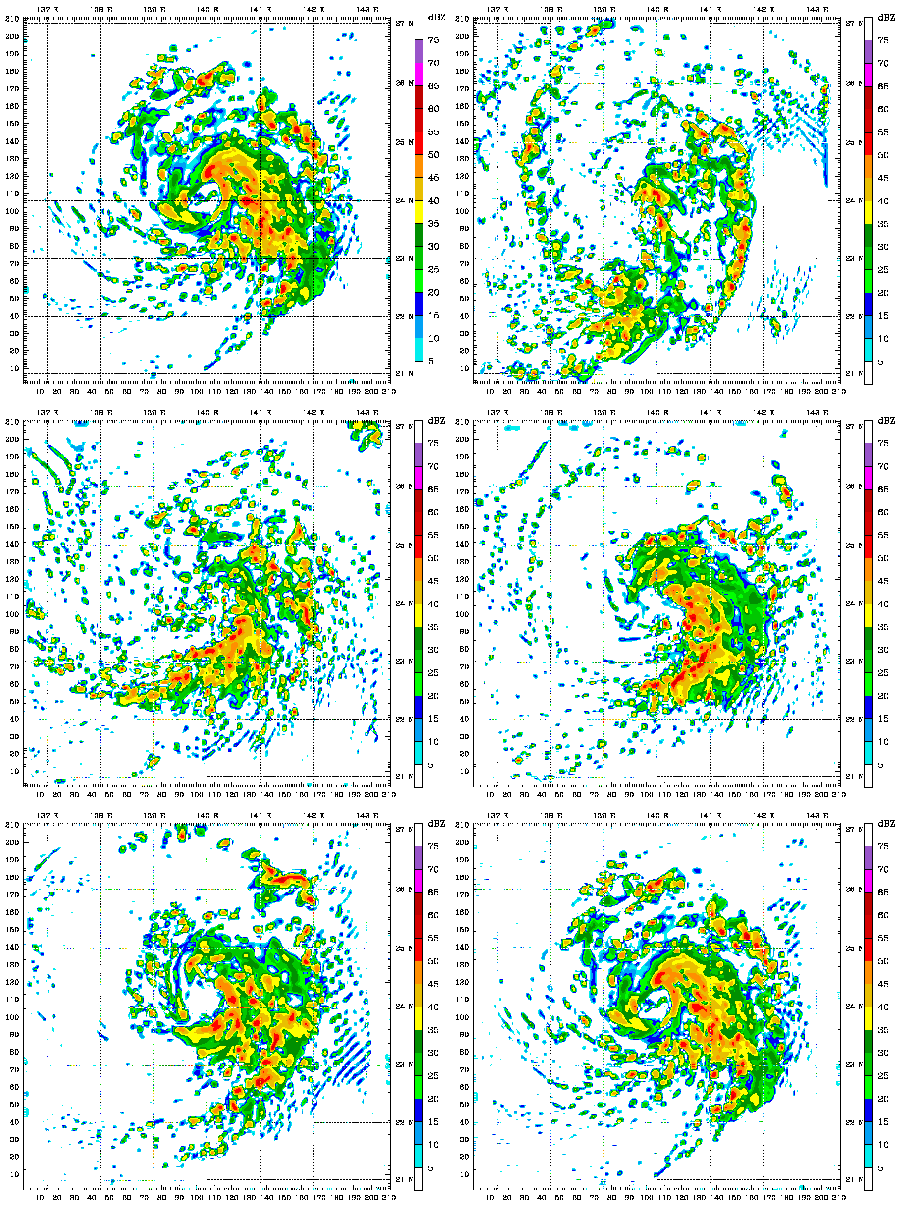
Computer simulation is the running of a mathematical model on a computer, the model being designed to represent the behaviour of, or the outcome of, a real-world or physical system. The reliability of some mathematical models can be determined by comparing their results to the real-world outcomes they aim to predict. Computer simulations have become a useful tool for the mathematical modeling of many natural systems in physics (computational physics), astrophysics, climatology, chemistry, biology and manufacturing, as well as human systems in economics, psychology, social science, health care and engineering. Simulation of a system is represented as the running of the system's model. It can be used to explore and gain new insights into new technology and to estimate the performance of systems too complex for analytical solutions. Computer simulations are realized by running computer programs that can be either small, running almost instantly on small devices, or large-scale p ... [...More Info...] [...Related Items...] OR: [Wikipedia] [Google] [Baidu] |
Flow Tracer
A flow tracer is any fluid property used to track the flow velocity (i.e., flow magnitude and direction) and circulation patterns. Tracers can be chemical properties, such as radioactive material, or chemical compounds, physical properties, such as density, temperature, salinity, or dyes, and can be natural or artificially induced. Flow tracers are used in many fields, such as physics, hydrology, limnology, oceanography, environmental studies and atmospheric studies. Conservative tracers remain constant following fluid parcels, whereas reactive tracers (such as compounds undergoing a mutual chemical reaction) grow or decay with time. ''Active tracers'' dynamically alter the flow of the fluid by changing fluid properties which appear in the equation of motion such as density or viscosity, while ''passive tracers'' have no influence on flow. Uses in oceanography Ocean tracers are used to deduce small scale flow patterns, large-scale ocean circulation, water mass formation a ... [...More Info...] [...Related Items...] OR: [Wikipedia] [Google] [Baidu] |
Water Level
Water level, also known as gauge height or stage, is the elevation of the free surface of a sea, stream, lake or reservoir relative to a specified vertical datum. Over long distances, neglecting external forcings (such as wind), water level tends to conform to an equigeopotential surface. See also * Water level (device), device utilizing the surface of liquid water to establish a local horizontal plane of reference * Flood stage * Hydraulic head * Stream gauge ** Water level gauges * Tide gauge * Level sensor * Liquid level * Reference water level * Stage (hydrology) * Sea level Mean sea level (MSL, often shortened to sea level) is an mean, average surface level of one or more among Earth's coastal Body of water, bodies of water from which heights such as elevation may be measured. The global MSL is a type of vertical ... References Hydrology Vertical position {{hydrology-stub ... [...More Info...] [...Related Items...] OR: [Wikipedia] [Google] [Baidu] |
Rating Curve
In hydrology Hydrology () is the scientific study of the movement, distribution, and management of water on Earth and other planets, including the water cycle, water resources, and drainage basin sustainability. A practitioner of hydrology is called a hydro ..., a rating curve is a graph of discharge versus stage for a given point on a stream, usually at gauging stations, where the stream discharge is measured across the stream channel with a flow meter. Numerous measurements of stream discharge are made over a range of stream stages. The rating curve is usually plotted as discharge on x-axis versus stage (surface elevation) on y-axis. The development of a rating curve involves two steps. In the first step the relationship between stage and discharge is established by measuring the stage and corresponding discharge in the river. And in the second part, stage of river is measured and discharge is calculated by using the relationship established in the first part. Stage is m ... [...More Info...] [...Related Items...] OR: [Wikipedia] [Google] [Baidu] |
Discharge (hydrology)
In hydrology, discharge is the volumetric flow rate (volume per time, in units of m3/h or ft3/h) of a stream. It equals the product of average flow velocity (with dimension of length per time, in m/h or ft/h) and the cross-sectional area (in m2 or ft2). It includes any suspended solids (e.g. sediment), dissolved chemicals like (aq), or biologic material (e.g. diatoms) in addition to the water itself. Terms may vary between disciplines. For example, a fluvial hydrologist studying natural river systems may define discharge as streamflow, whereas an engineer operating a reservoir system may equate it with outflow, contrasted with inflow. Formulation A discharge is a measure of the quantity of any fluid flow over unit time. The quantity may be either volume or mass. Thus the water discharge of a tap (faucet) can be measured with a measuring jug and a stopwatch. Here the discharge might be 1 litre per 15 seconds, equivalent to 67 ml/second or 4 litres/minute. This is an average meas ... [...More Info...] [...Related Items...] OR: [Wikipedia] [Google] [Baidu] |

