|
Sociogram
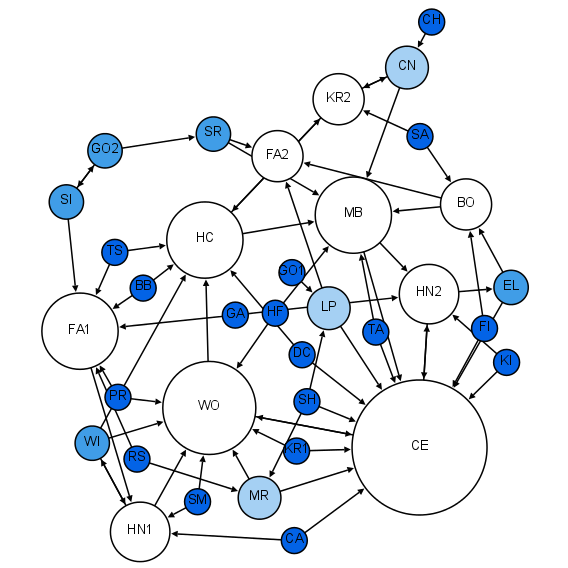
A sociogram is a graphic representation of social links that a person has. It is a graph drawing that plots the structure of interpersonal relations in a group situation. Overview Sociograms were developed by Jacob L. Moreno to analyze choices or preferences within a group. They can diagram the structure and patterns of group interactions. A sociogram can be drawn on the basis of many different criteria: Social relations, channels of influence, lines of communication etc. Those points on a sociogram who have many choices are called stars. Those with few or no choices are called isolates. Individuals who choose each other are known to have made a mutual choice. One-way choice refers to individuals who choose someone but the choice is not reciprocated. Cliques are groups of three or more people within a larger group who all choose each other (mutual choice). Sociograms are the charts or tools used to find the sociometry of a social space. Under the social discipline model ... [...More Info...] [...Related Items...] OR: [Wikipedia] [Google] [Baidu] |
Sociometry
Sociometry is a quantitative method for measuring Social relation, social relationships. It was developed by psychotherapy, psychotherapist Jacob L. Moreno and Helen Hall Jennings in their studies of the relationship between social structures and psychological well-being, and used during Remedial Teaching. Definition The term sociometry relates to its Latin etymology, ''socius'' meaning companion, and ''metrum'' meaning measure. Jacob Moreno defined sociometry as "the inquiry into the evolution and organization of groups and the position of individuals within them." He goes on to write "As the ...science of group organization, it attacks the problem not from the outer structure of the group, the group surface, but from the inner structure". "Sociometric explorations reveal the hidden structures that give a group its form: the alliances, the subgroups, the hidden beliefs, the forbidden agendas, the ideological agreements, the "stars" of the show." Moreno developed sociometry as ... [...More Info...] [...Related Items...] OR: [Wikipedia] [Google] [Baidu] |
Network Science
Network science is an academic field which studies complex networks such as telecommunication networks, computer networks, biological networks, Cognitive network, cognitive and semantic networks, and social networks, considering distinct elements or actors represented by ''nodes'' (or ''vertices'') and the connections between the elements or actors as ''links'' (or ''edges''). The field draws on theories and methods including graph theory from mathematics, statistical mechanics from physics, data mining and information visualization from computer science, inferential statistics, inferential modeling from statistics, and social structure from sociology. The United States National Research Council defines network science as "the study of network representations of physical, biological, and social phenomena leading to predictive models of these phenomena." Background and history The study of networks has emerged in diverse disciplines as a means of analyzing complex relational ... [...More Info...] [...Related Items...] OR: [Wikipedia] [Google] [Baidu] |
Graph Drawing
Graph drawing is an area of mathematics and computer science combining methods from geometric graph theory and information visualization to derive two-dimensional depictions of graph (discrete mathematics), graphs arising from applications such as social network analysis, cartography, linguistics, and bioinformatics. A drawing of a graph or network diagram is a pictorial representation of the vertex (graph theory), vertices and edge (graph theory), edges of a graph. This drawing should not be confused with the graph itself: very different layouts can correspond to the same graph., p. 6. In the abstract, all that matters is which pairs of vertices are connected by edges. In the concrete, however, the arrangement of these vertices and edges within a drawing affects its understandability, usability, fabrication cost, and aesthetics. The problem gets worse if the graph changes over time by adding and deleting edges (dynamic graph drawing) and the goal is to preserve the user's men ... [...More Info...] [...Related Items...] OR: [Wikipedia] [Google] [Baidu] |
Psychogram
Psychogram is a term sometimes used in fields within psychology such as personality theory and perception as well as graphology and handwriting analysis, although the term has multiple senses, many of them outdated, and none of the senses of the term are defined clearly or used consistently. One sense of the term is from psychological research in the middle of the twentieth century, meaning a composite psychological measurement which attempts to integrate various elements of a person's thought processes, often a diagram, usually in the form of a circle. According to one source, in this sense, a psychogram denoted "not the sum of elements but their interrelationship" as a way to reduce "complex happenings to a simple design which enables the individual to make his decision." The term was used by a few psychologists such as Daniel S. Anthony in the 1960s, It was used as a visual representation or "map" of an individual's personality. The term never caught on within the mainstream psyc ... [...More Info...] [...Related Items...] OR: [Wikipedia] [Google] [Baidu] |
Barry Wellman
Barry Wellman (30 September 1942 – 9 July 2024) was an American-Canadian sociologist and was the co-director of the Toronto-based international NetLab Network. His areas of research were community sociology, the Internet, human–computer interaction and social structure, as manifested in social networks in communities and organizations. His overarching interest was in the paradigm shift from group-centered relations to ''networked individualism''. He wrote and co-authored more than 300 articles, chapters, reports and books. Wellman was a professor at the Department of Sociology, University of Toronto, for 46 years, from 1967 to 2013, including a five-year stint as the S. D. Clark Professor. Among the theories Wellman helped develop were: "network of networks" and "the network city" (both with Paul Craven), "the community question", "computer networks as social networks", "connected lives" and the "immanent Internet" (both with Bernie Hogan), " media-multiplexity" (with Car ... [...More Info...] [...Related Items...] OR: [Wikipedia] [Google] [Baidu] |
Sociomapping
Sociomapping is a method developed for processing and visualization of relational data (e.g. social network data). It is most commonly used for mapping the social structure within small teams (10-25 people). Sociomapping uses the landscape metaphor to display complex multi-dimensional data in a 3D map, where individual objects are localized in such way that their distance on the map corresponds to their distance in the underlying data. Thanks to its visual coding Sociomapping engages our evolved skills for spatial orientation and movement detection, thus making the interpretation of complex data easy and accessible for everyone. History The sociomapping method was developed in 19931994 by R. Bahbouh as a tool that would facilitate understanding of data about social relations and help preventing conflicts within teams of military professionals. The first major application of sociomapping took place in 19941995 during the HUBES experiment (Human Behavior in Extended Spaceflight) � ... [...More Info...] [...Related Items...] OR: [Wikipedia] [Google] [Baidu] |
Social Balance Theory
Social balance theory is a class of theories about balance or imbalance of sentiment relation in dyadic or triadic relations with social network theory.Hokky Situngkir and Deni Khanafiah. 2004. Social balance theory: Revisiting heider’s balance theory for many agents. ''Technical Report''. Sentiments can result in the emergence of two groups. Disliking exists between the two subgroups within liking agents. Development of the theory This theory evolved over time to produce models more closely resembling real-world social networks. It uses a balance index to measure the effect of local balance on that of a global level and also on a more intimate level, like in interpersonal relationships. Dorwin Cartwright and Frank Harary introduced ''clustering'' to account for multiple social cliques. Davis introduced ''hierarchical clustering'' to account for asymmetric relations. The topology and hubness of positive and negative links have been shown to significantly affect the structur ... [...More Info...] [...Related Items...] OR: [Wikipedia] [Google] [Baidu] |
Organizational Chart
An organizational chart, also called organigram, organogram, or organizational breakdown structure (OBS), is a diagram that shows the structure of an organization and the relationships and relative ranks of its parts and positions/jobs. The term is also used for similar diagrams, for example ones showing the different elements of a field of knowledge or a group of languages. Overview The organization chart is a diagram showing graphically the relation of one official to another, or others, of a company. It is also used to show the relation of one department to another, or others, or of one function of an organization to another, or others. This chart is valuable in that it enables one to visualize a complete organization, by means of the picture it presents.Allan Cecil Haskell, Joseph G. Breaznell (1922) Graphic charts in business: how to make and use them'. p. 78 A company's organizational chart typically illustrates relations between people within an organization. Such rel ... [...More Info...] [...Related Items...] OR: [Wikipedia] [Google] [Baidu] |
Diagram
A diagram is a symbolic Depiction, representation of information using Visualization (graphics), visualization techniques. Diagrams have been used since prehistoric times on Cave painting, walls of caves, but became more prevalent during the Age of Enlightenment, Enlightenment. Sometimes, the technique uses a Three-dimensional space, three-dimensional visualization which is then graphical projection, projected onto a two-dimensional surface. The word ''graphics, graph'' is sometimes used as a synonym for diagram. Overview The term "diagram" in its commonly used sense can have a general or specific meaning: * ''visual information device'' : Like the term "illustration", "diagram" is used as a collective term standing for the whole class of technical genres, including graphics, graphs, technical drawings and tables. * ''specific kind of visual display'' : This is the genre that shows qualitative data with shapes that are connected by lines, arrows, or other visual links. In scie ... [...More Info...] [...Related Items...] OR: [Wikipedia] [Google] [Baidu] |
Social
Social organisms, including human(s), live collectively in interacting populations. This interaction is considered social whether they are aware of it or not, and whether the exchange is voluntary or not. Etymology The word "social" derives from the Latin word ''socii'' ("allies"). It is particularly derived from the Italian '' Socii'' states, historical allies of the Roman Republic (although they rebelled against Rome in the Social War of 91–87 BC). Social theorists In the view of Karl Marx,Morrison, Ken. ''Marx, Durkheim, Weber. Formations of modern social thought'' human beings are intrinsically, necessarily and by definition social beings who, beyond being "gregarious creatures", cannot survive and meet their needs other than through social co-operation and association. Their social characteristics are therefore to a large extent an objectively given fact, stamped on them from birth and affirmed by socialization processes; and, according to Marx, in producing and reproduc ... [...More Info...] [...Related Items...] OR: [Wikipedia] [Google] [Baidu] |


