|
Sankey Diagram
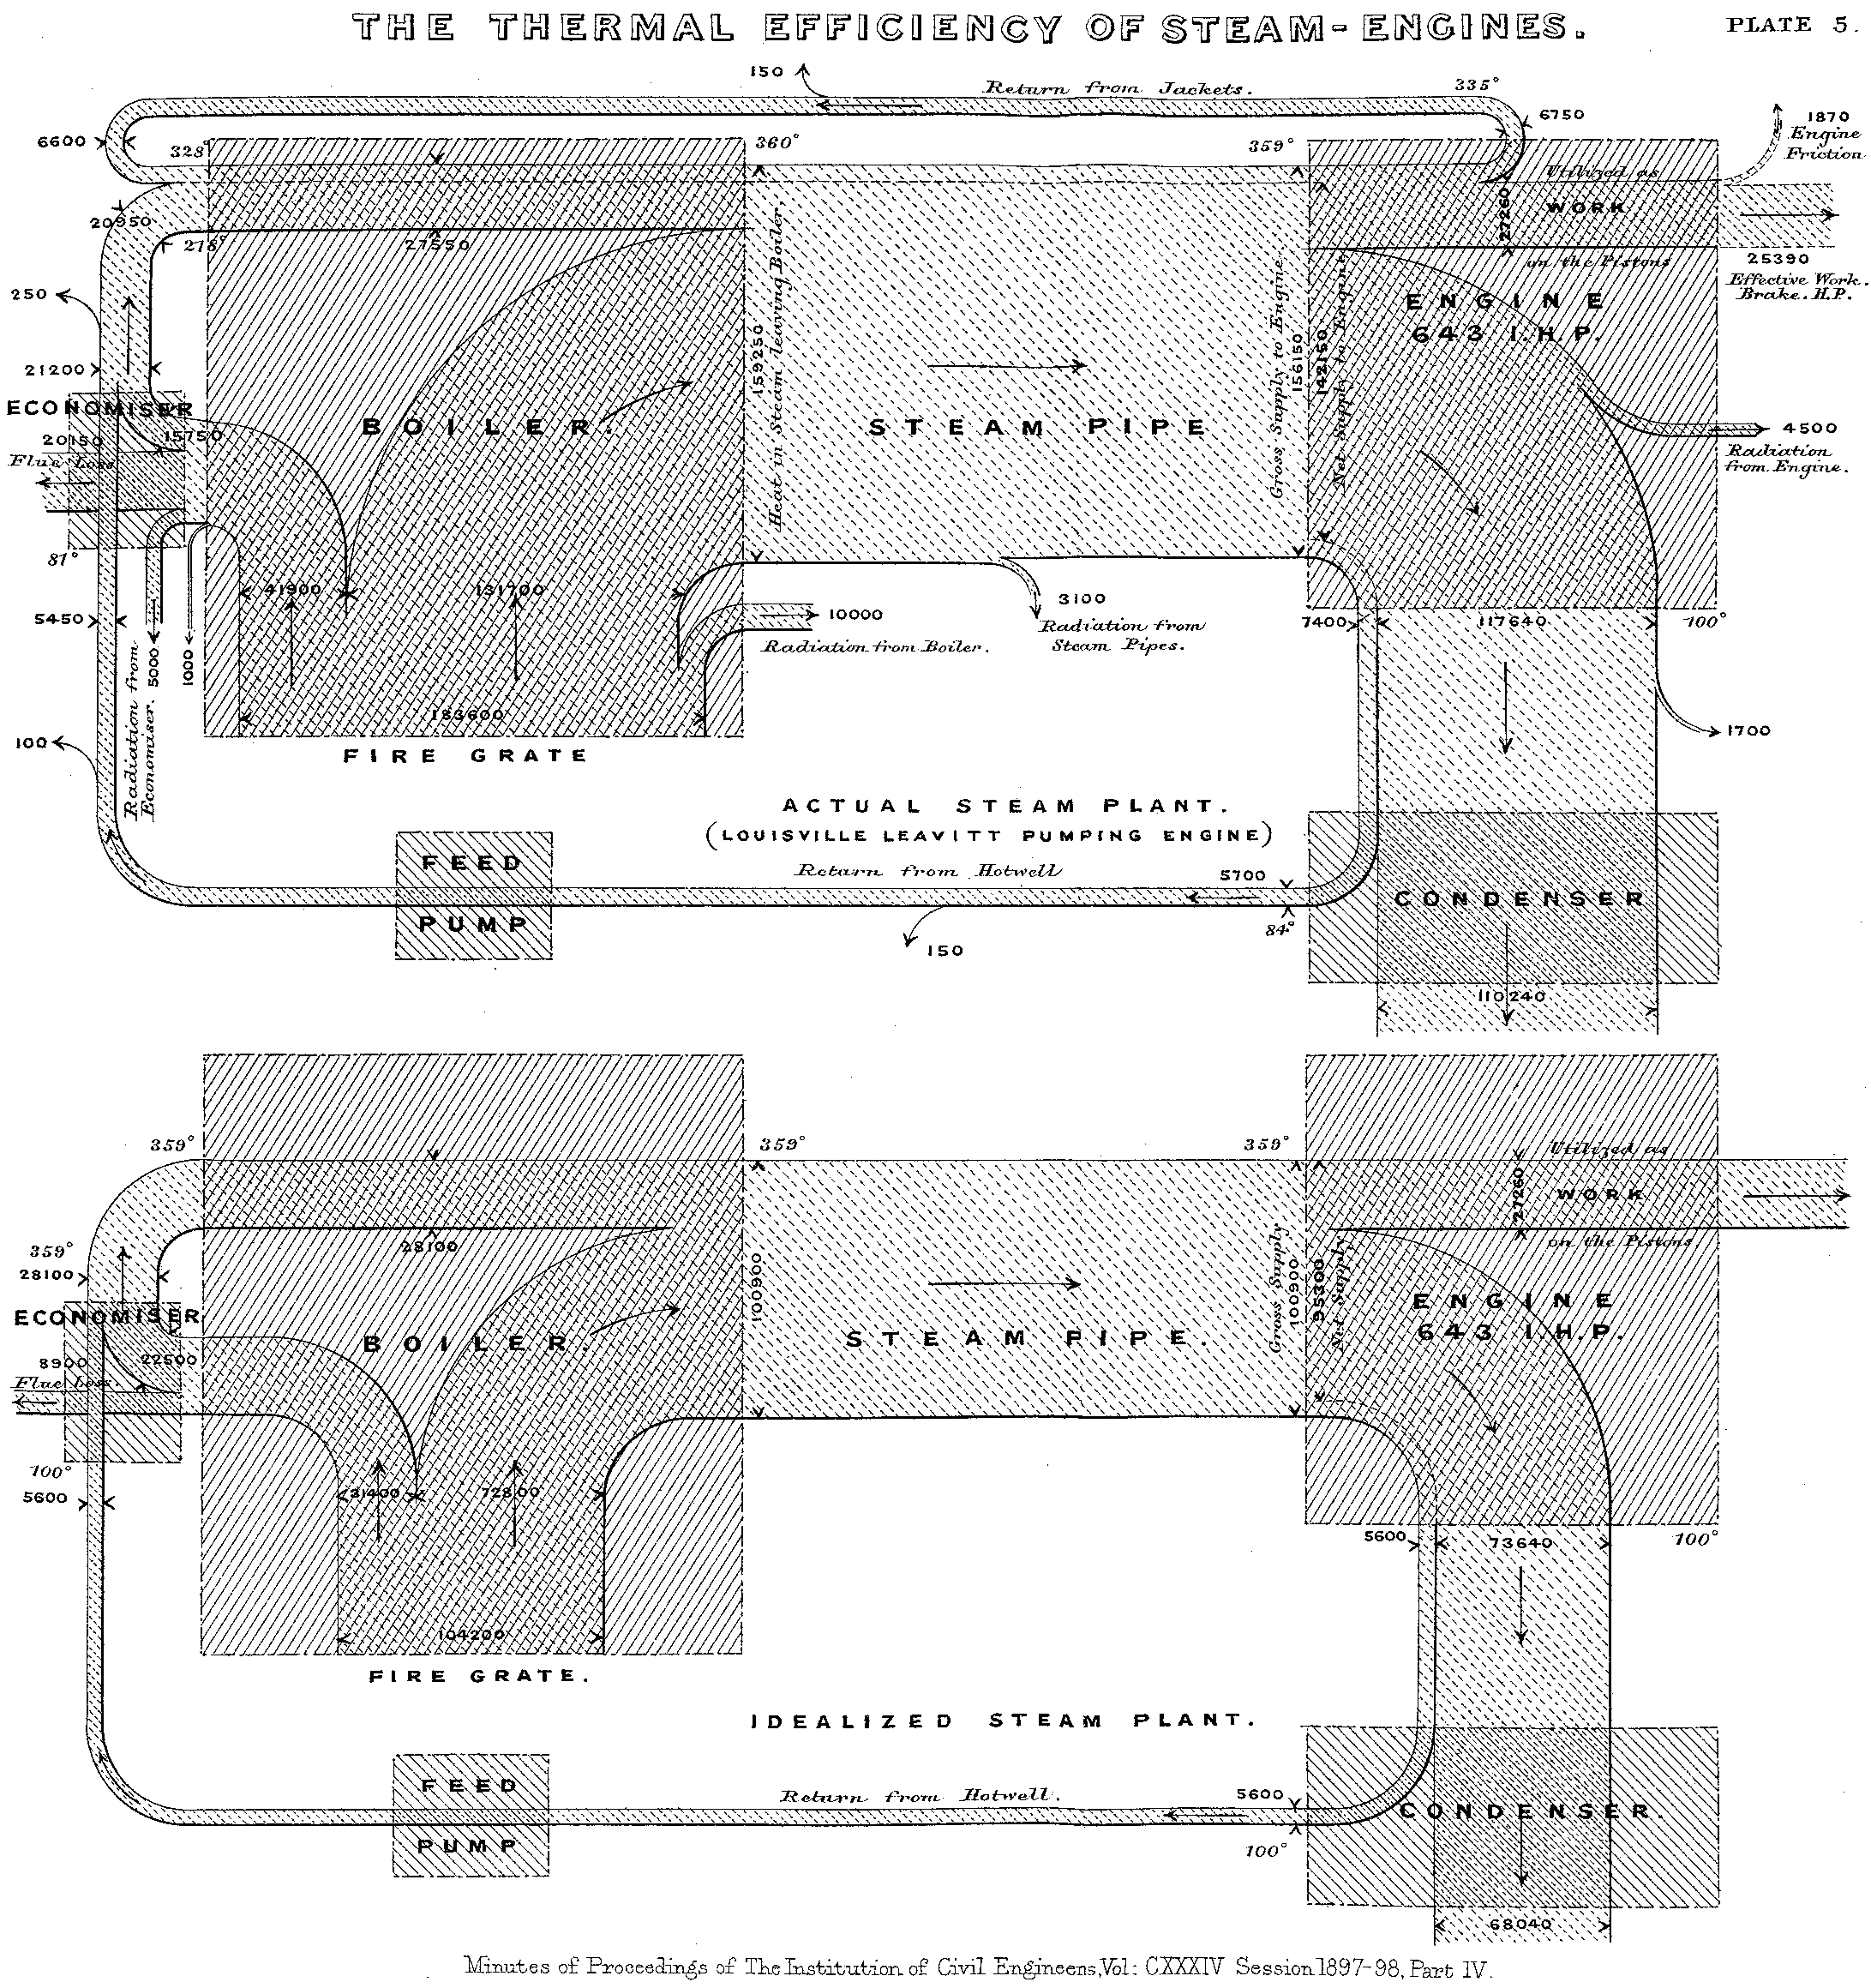
Sankey diagrams are a data visualisation technique or flow diagram that emphasizes flow/movement/change from one state to another or one time to another, in which the width of the arrows is proportional to the flow rate of the depicted extensive property. The arrows being connected are called nodes and the connections are called links. Sankey diagrams can also visualize the energy accounts, material flow accounts on a regional or national level, and cost breakdowns. The diagrams are often used in the visualization of material flow analysis. Sankey diagrams emphasize the major transfers or flows within a system. They help locate the most important contributions to a flow. They often show conserved quantities within defined system boundaries. History and name Sankey diagrams are named after Irish Captain Matthew Henry Phineas Riall Sankey, who used this type of diagram in 1898 in a classic figure (see diagram) showing the energy efficiency of a steam engine. The original chart ... [...More Info...] [...Related Items...] OR: [Wikipedia] [Google] [Baidu] |
Flow Map
A flow map is a type of thematic map that uses linear Map symbol, symbols to represent movement between locations. It may thus be considered a hybrid of a map and a flow diagram. The movement being mapped may be that of anything, including people, highway traffic, trade goods, water, ideas, telecommunications data, etc. The wide variety of moving material, and the variety of geographic networks through they move, has led to many different design strategies. Some cartographers have expanded this term to any thematic map of a Transport network, linear network, while others restrict its use to maps that specifically show movement of some kind. Many flow maps use line width proportional to the amount of flow, making them similar to other maps that use proportional Visual variable, size, including cartograms (altering region area), and Proportional symbol map, proportional point symbols. History The earliest known map to visually represent the volume of flow were two maps by enginee ... [...More Info...] [...Related Items...] OR: [Wikipedia] [Google] [Baidu] |
Diagrams
A diagram is a symbolic representation of information using visualization techniques. Diagrams have been used since prehistoric times on walls of caves, but became more prevalent during the Enlightenment. Sometimes, the technique uses a three-dimensional visualization which is then projected onto a two-dimensional surface. The word '' graph'' is sometimes used as a synonym for diagram. Overview The term "diagram" in its commonly used sense can have a general or specific meaning: * ''visual information device'' : Like the term "illustration", "diagram" is used as a collective term standing for the whole class of technical genres, including graphs, technical drawings and tables. * ''specific kind of visual display'' : This is the genre that shows qualitative data with shapes that are connected by lines, arrows, or other visual links. In science the term is used in both ways. For example, Anderson (1997) stated more generally: "diagrams are pictorial, yet abstract, represen ... [...More Info...] [...Related Items...] OR: [Wikipedia] [Google] [Baidu] |
Time Geography
Time geography or time-space geography is an evolving transdisciplinary perspective on spatial and temporal processes and events such as social interaction, ecological interaction, social and environmental change, and biographies of individuals. Time geography "is not a subject area per se", but rather an integrative ontological framework and visual language in which space and time are basic dimensions of analysis of dynamic processes. Time geography was originally developed by human geographers, but today it is applied in multiple fields related to transportation, regional planning, geography, anthropology, time-use research, ecology, environmental science, and public health. According to Swedish geographer Bo Lenntorp: "It is a basic approach, and every researcher can connect it to theoretical considerations in her or his own way." Origins The Swedish geographer Torsten Hägerstrand created time geography in the mid-1960s based on ideas he had developed during his earlie ... [...More Info...] [...Related Items...] OR: [Wikipedia] [Google] [Baidu] |
Parallel Coordinates
Parallel Coordinates plots are a common method of visualizing high-dimensional datasets to analyze multivariate data having multiple variables, or attributes. To plot, or visualize, a set of points in ''n''-dimensional space, ''n'' parallel lines are drawn over the background representing coordinate axes, typically oriented vertically with equal spacing. Points in ''n''-dimensional space are represented as individual polylines with ''n'' vertices placed on the parallel axes corresponding to each coordinate entry of the ''n''-dimensional point, vertices are connected with ''n-1'' polyline segments. This data visualization is similar to time series visualization, except that Parallel Coordinates are applied to data which do not correspond with chronological time. Therefore, different axes arrangements can be of interest, including reflecting axes horizontally, otherwise inverting the attribute range. History The concept of Parallel Coordinates is often said to originate in ... [...More Info...] [...Related Items...] OR: [Wikipedia] [Google] [Baidu] |
Material Flow Management
Material flow management (MFM) is an economic focused method of analysis and reformation of goods production and subsequent waste through the lens of material flows, incorporating themes of sustainability and the theory of a circular economy. It is used in social, medical, and urban contexts. However, MFM has grown in the field of industrial ecology, combining both technical and economic approaches to minimize waste that impacts economic prosperity and the environment. It has been heavily utilized by the country of Germany, but it has been applied to the industries of various other countries. The material flow management process utilizes the Sankey diagram, and echoes the circular economy model, while being represented in media environments as a business model which may help lower the costs of production and waste. Context Material flow management began as a largely academic discourse, eventually becoming an actual tool implemented by both countries and industries. The first cle ... [...More Info...] [...Related Items...] OR: [Wikipedia] [Google] [Baidu] |
Alluvial Diagram
Alluvial diagrams are a type of flow diagram originally developed to represent changes in network structure over time. In allusion to both their visual appearance and their emphasis on flow, alluvial diagrams are named after alluvial fans that are naturally formed by the soil deposited from streaming water. Interpretation In an alluvial diagram, blocks represent clusters of nodes, and stream fields between the blocks represent changes in the composition of these clusters over time. The height of a block represents the size of the cluster and the height of a stream field represents the size of the components contained in both blocks connected by the stream field. Application Alluvial diagrams were originally developed to visualize structural change in large complex networks. They can be used to visualize any type of change in group composition between states or over time and include statistical information to reveal significant change. Alluvial diagrams highlight important stru ... [...More Info...] [...Related Items...] OR: [Wikipedia] [Google] [Baidu] |
Balance Of Trade With The United States By Country
Balance may refer to: Common meanings * Balance (ability) in biomechanics * Balance (accounting) * Balance or weighing scale * Balance, as in equality (mathematics) or equilibrium Arts and entertainment Film * ''Balance'' (1983 film), a Bulgarian film * ''Balance'' (1989 film), a short animated film * '' La Balance'', a 1982 French film Television * '' Balance: Television for Living Well'', a Canadian television talk show * "The Balance" (Roswell), an episode of the television series ''Roswell'' * "The Balance", an episode of the animated series ''Justice League Unlimited'' Music Performers * Balance (band), a 1980s pop-rock group Albums * ''Balance'' (Akrobatik album), 2003 * ''Balance'' (Kim-Lian album), 2004 * ''Balance'' (Leo Kottke album), 1978 * ''Balance'' (Masta Killa album), 2025 * ''Balance'' (Joe Morris album), 2014 * ''Balance'' (Swollen Members album), 1999 * ''Balance'' (Ty Tabor album), 2008 * ''Balance'' (Melly Goeslaw album), 2013 * ''Balance'' (Van ... [...More Info...] [...Related Items...] OR: [Wikipedia] [Google] [Baidu] |
International Energy Agency
The International Energy Agency (IEA) is a Paris-based autonomous intergovernmental organization, established in 1974, that provides policy recommendations, analysis and data on the global energy sector. The 31 member countries and 13 association countries of the IEA represent 75% of global energy demand. The IEA was set up under the framework of the Organisation for Economic Co-operation and Development (OECD) in the aftermath of the 1973 oil crisis to respond to physical disruptions in global oil supplies, provide data and statistics about the global Petroleum industry, oil market and Energy industry, energy sector, promote energy savings and conservation, and establish international technical collaboration. Since its founding, the IEA has also coordinated use of the oil reserves that its members are required to hold. By regularly underestimating the role of renewable energies and overestimating the growth of nuclear energy, the IEA promotes the nuclear industry. In subsequen ... [...More Info...] [...Related Items...] OR: [Wikipedia] [Google] [Baidu] |
Eurostat
Eurostat ("European Statistical Office"; also DG ESTAT) is a department of the European Commission ( Directorate-General), located in the Kirchberg quarter of Luxembourg City, Luxembourg. Eurostat's main responsibilities are to provide statistical information to the institutions of the European Union (EU) and to promote the harmonisation of statistical methods across its member states and candidates for accession as well as EFTA countries. The organisations in the different countries that cooperate with Eurostat are summarised under the concept of the European Statistical System. Organisation Eurostat operates pursuant to Regulation (EC) No 223/2009. Since the swearing in of the von der Leyen Commission in December 2019, Eurostat is allocated to the portfolio of the European Commissioner for the Economy, Paolo Gentiloni. The Director-General of Eurostat is Mariana Kotzeva, former Deputy Director-General of Eurostat and President of the National Statistical Institute ... [...More Info...] [...Related Items...] OR: [Wikipedia] [Google] [Baidu] |
Earth Heat Balance Sankey Diagram
Earth is the third planet from the Sun and the only astronomical object known to Planetary habitability, harbor life. This is enabled by Earth being an ocean world, the only one in the Solar System sustaining liquid surface water. Almost all of Earth's water is contained in its global ocean, covering Water distribution on Earth, 70.8% of Earth's crust. The remaining 29.2% of Earth's crust is land, most of which is located in the form of continental landmasses within Earth's land hemisphere. Most of Earth's land is at least somewhat humid and covered by vegetation, while large Ice sheet, sheets of ice at Polar regions of Earth, Earth's polar polar desert, deserts retain more water than Earth's groundwater, lakes, rivers, and Water vapor#In Earth's atmosphere, atmospheric water combined. Earth's crust consists of slowly moving tectonic plates, which interact to produce mountain ranges, volcanoes, and earthquakes. Earth's outer core, Earth has a liquid outer core that generates a ... [...More Info...] [...Related Items...] OR: [Wikipedia] [Google] [Baidu] |
Charles Minard
Charles Joseph Minard (; ; 27 March 1781 – 24 October 1870) was a French civil engineer recognized for his significant contribution in the field of information graphics in civil engineering and statistics. Minard was, among other things, noted for his representation of numerical data on geographic maps, especially his flow maps. Early life Minard was born in Dijon in the Saint Michel parish. He was the son of Pierre Étienne Minard and Bénigne Boiteux. His father was a clerk of the court and an officer of the secondary school. Minard was baptized at Saint Michel on the day of his birth. From Posted by Edward Tufte. He was an intelligent child and his father encouraged him to study at an early age. At age four he learned to read and write, and when he was six his father enrolled him in an elementary course in anatomy. He completed his fourth year of study at the secondary school at Dijon early, and then applied himself to studying Latin, literature, and physical and math scie ... [...More Info...] [...Related Items...] OR: [Wikipedia] [Google] [Baidu] |


