|
Maucha Diagram
A Maucha diagram, or Maucha symbol, is a graphical representation of the major cations and anions in a chemical sample. R. Maucha published the symbol in 1932. It is mainly used by biologists and chemists for quickly recognising samples by their chemical composition. The symbol is similar in concept to the Stiff diagram. It conveys similar ionic information to the Piper diagram, though in a more compact format that is suitable as a map symbol or for showing changes with time. The Maucha diagram is a special case of the Radar chart and overcomes some of the limitations of the Pie chart by having equal angles for all variables and consistently showing each variable in the same position. The star shape comprises eight kite-shaped polygons, the area of each of which is proportional to the concentration of an ion in milliequivalents An equivalent (symbol: officially equiv; unofficially but often Eq) is the amount of a substance that reacts with (or is ''equivalent'' to) an arbitr ... [...More Info...] [...Related Items...] OR: [Wikipedia] [Google] [Baidu] |
Stiff Diagram
A Stiff diagram, or Stiff pattern, is a graphical representation of chemical analyses, first developed by H.A. Stiff in 1951. It is widely used by hydrogeologists and geochemists to display the major ion composition of a water sample. A polygonal shape is created from four parallel horizontal axes extending on either side of a vertical zero axis. Cations are plotted in milliequivalents per liter on the left side of the zero axis, one to each horizontal axis, and anions are plotted on the right side. Stiff patterns are useful in making a rapid visual comparison between water from different sources. An alternative to the Stiff diagram is the Maucha diagram. Stiff diagrams can be used: :1) to help visualize ionically related waters from which a flow path can be determined, or; :2) if the flow path is known, to show how the ionic composition of a water body changes over space and/or time. A typical Stiff diagram is shown in the figure (right). By standard convention, Stiff diagra ... [...More Info...] [...Related Items...] OR: [Wikipedia] [Google] [Baidu] |
Piper Diagram
A Piper diagram is a graphic procedure proposed by Arthur M. Piper in 1944 for presenting water chemistry data to help in understanding the sources of the dissolved constituent salts in water. This procedure is based on the premise that cations and anions in water are in such amounts to assure the electroneutrality of the dissolved salts, in other words the algebraic sum of the electric charges of cations and anions is zero. A Piper diagram is a graphical representation of the chemistry of a water sample or samples. The cations and anions are shown by separate ternary plots. The apexes of the cation plot are calcium, magnesium and sodium plus potassium cations. The apexes of the anion plot are sulfate, chloride and carbonate plus hydrogen carbonate anions. The two ternary plots are then projected onto a diamond. The diamond is a matrix transformation of a graph of the anions (sulfate + chloride/ total anions) and cations (sodium + potassium/total cations). The required matr ... [...More Info...] [...Related Items...] OR: [Wikipedia] [Google] [Baidu] |
Radar Chart
A radar chart is a graphical method of displaying multivariate data in the form of a two-dimensional chart of three or more quantitative variables represented on axes starting from the same point. The relative position and angle of the axes is typically uninformative, but various heuristics, such as algorithms that plot data as the maximal total area, can be applied to sort the variables (axes) into relative positions that reveal distinct correlations, trade-offs, and a multitude of other comparative measures. The radar chart is also known as web chart, spider chart, spider graph, spider web chart, star chart, star plot, cobweb chart, irregular polygon, polar chart, or Kiviat diagram. It is equivalent to a parallel coordinates plot, with the axes arranged radially. Overview The radar chart is a chart and/or plot that consists of a sequence of equi-angular spokes, called radii, with each spoke representing one of the variables. The data length of a spoke is proportional t ... [...More Info...] [...Related Items...] OR: [Wikipedia] [Google] [Baidu] |
Pie Chart
A pie chart (or a circle chart) is a circular statistical graphic, which is divided into slices to illustrate numerical proportion. In a pie chart, the arc length of each slice (and consequently its central angle and area) is proportional to the quantity it represents. While it is named for its resemblance to a pie which has been sliced, there are variations on the way it can be presented. The earliest known pie chart is generally credited to William Playfair's ''Statistical Breviary'' of 1801.Spence (2005)Tufte, p. 44 Pie charts are very widely used in the business world and the mass media.Cleveland, p. 262 However, they have been criticized,Wilkinson, p. 23. and many experts recommend avoiding them,Tufte, p. 178.van Belle, p. 160–162.Stephen Few"Save the Pies for Dessert" August 2007, Retrieved 2010-02-02Steve Fento"Pie Charts Are Bad"/ref> as research has shown it is difficult to compare different sections of a given pie chart, or to compare data across different pie ... [...More Info...] [...Related Items...] OR: [Wikipedia] [Google] [Baidu] |
Equivalent Concentration
In chemistry, the equivalent concentration or normality (N) of a solution is defined as the molar concentration ''ci'' divided by an equivalence factor ''f''eq: :Normality = Definition Normality is defined as the number of gramme or mole equivalents of solute present in one litre of solution. The SI unit of normality is Eq/L. Normality formula :Normality (N) = Weight of Solute (in gm) / (Equivalent Weight of Solute × Volume of the Solution (in liters))https://clavick.com/normality/ Usage There are three common types of chemical reaction where normality is used as a measure of reactive species in solution: *In acid-base chemistry, normality is used to express the concentration of hydronium ions (H3O+) or hydroxide ions (OH−) in a solution. Here, is an integer value. Each solute can produce one or more equivalents of reactive species when dissolved. *In redox reactions, the equivalence factor describes the number of electrons that an oxidizing or reducing agent ca ... [...More Info...] [...Related Items...] OR: [Wikipedia] [Google] [Baidu] |
Analytical Chemistry
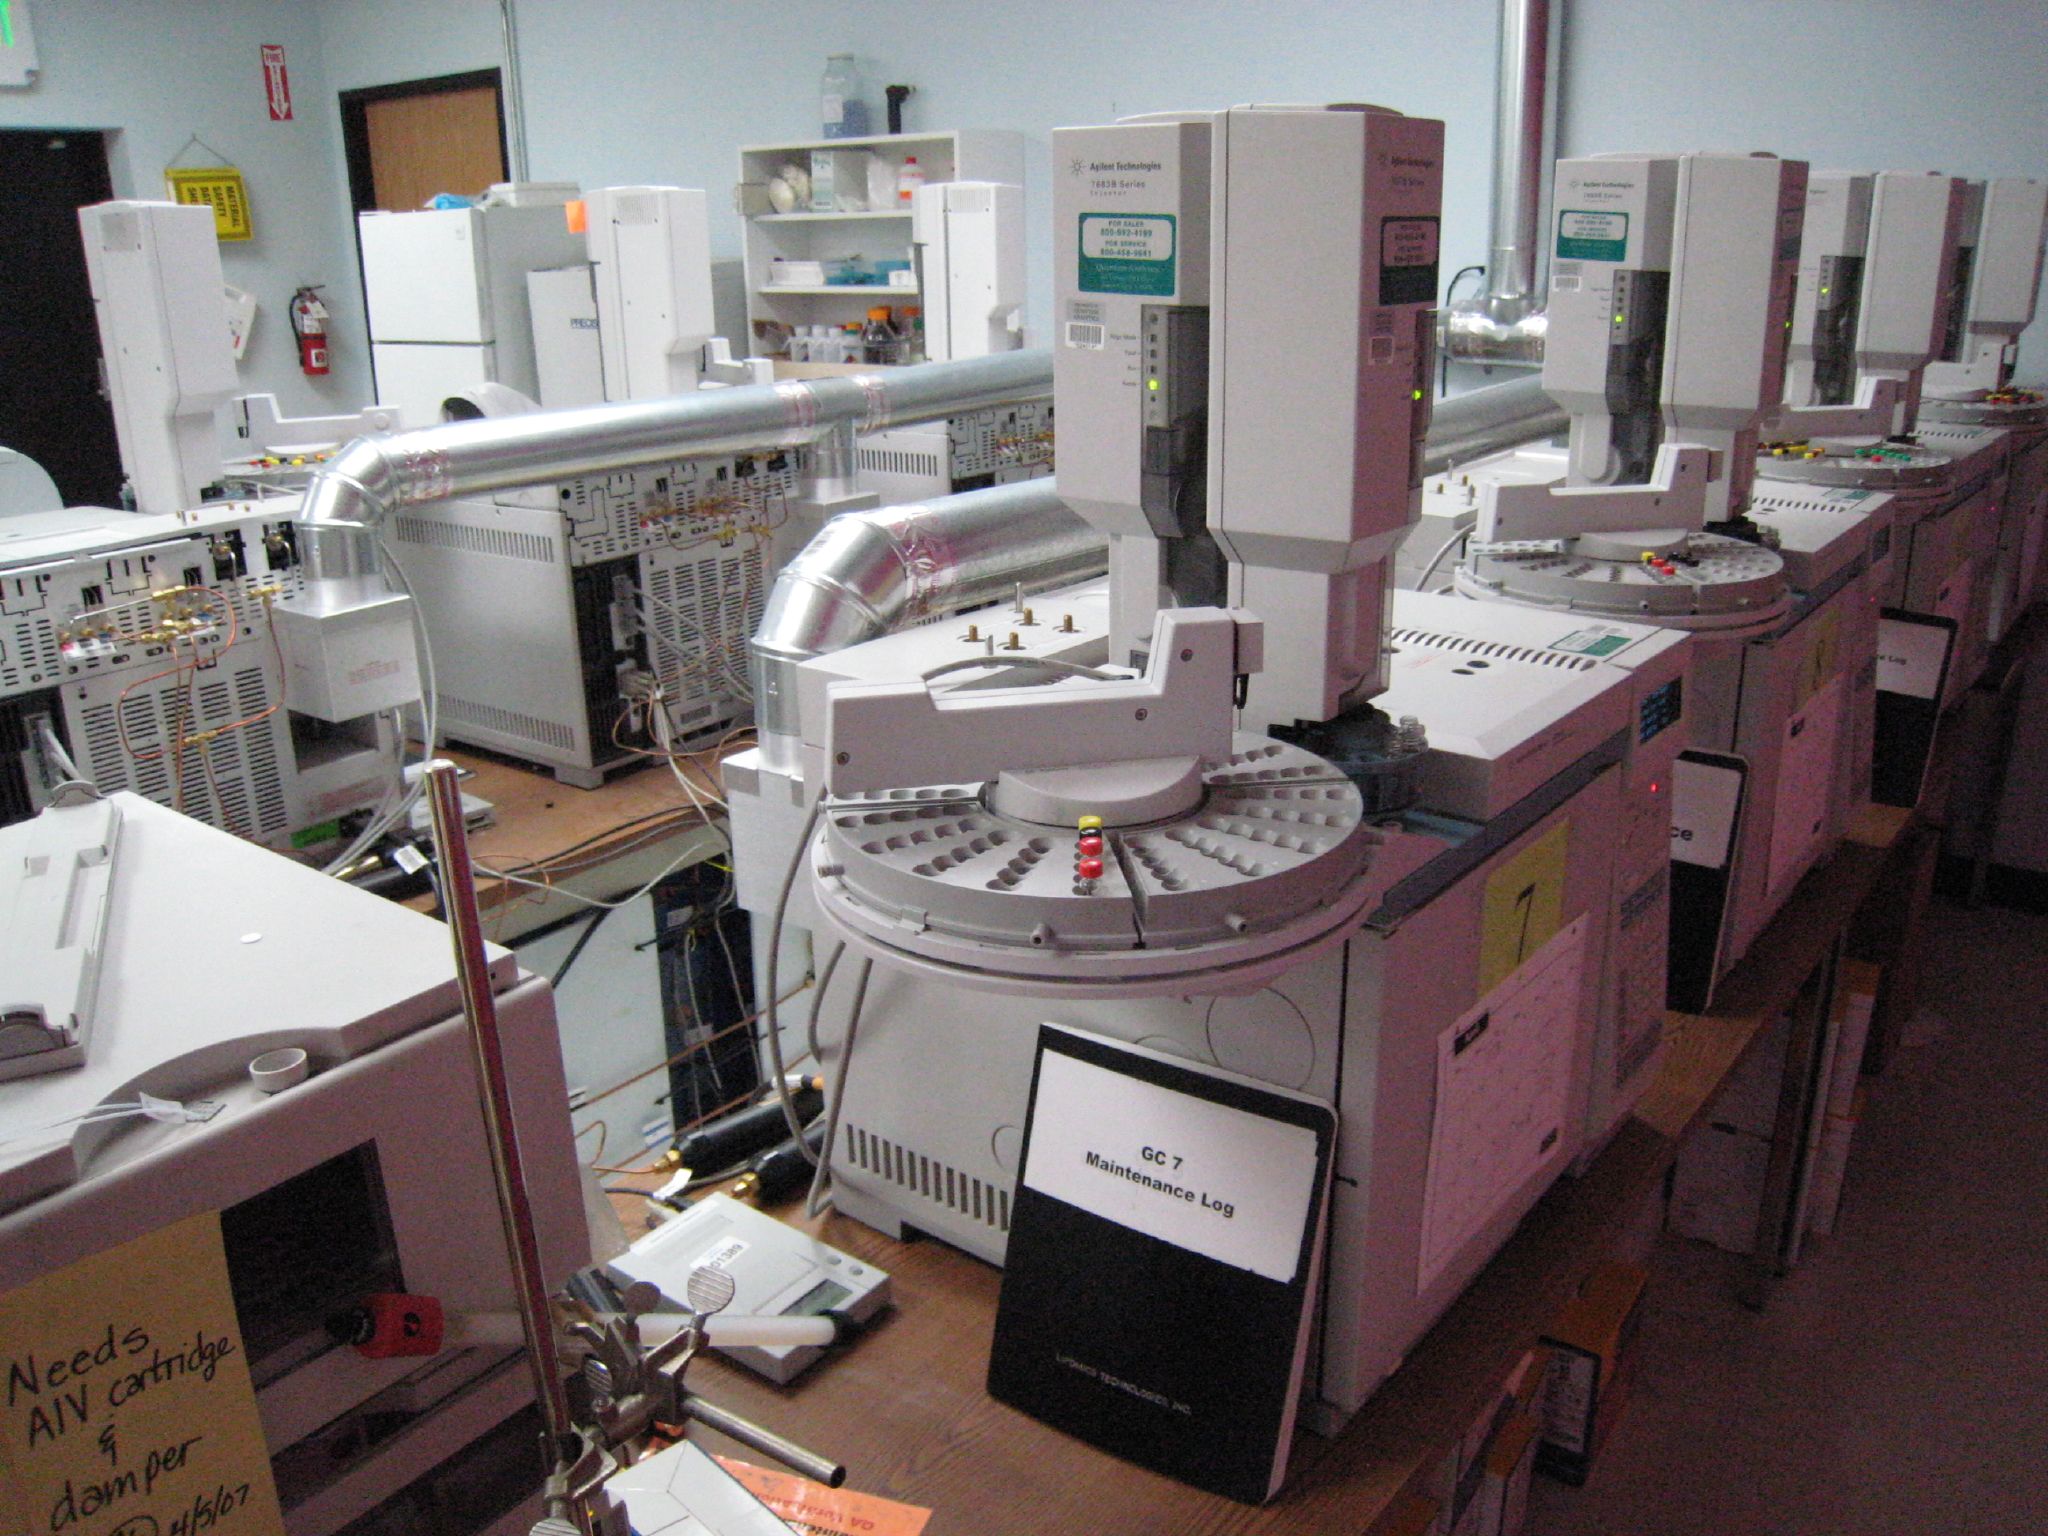
Analytical chemistry studies and uses instruments and methods to separate, identify, and quantify matter. In practice, separation, identification or quantification may constitute the entire analysis or be combined with another method. Separation isolates analytes. Qualitative analysis identifies analytes, while quantitative analysis determines the numerical amount or concentration. Analytical chemistry consists of classical, wet chemical methods and modern, instrumental methods. Classical qualitative methods use separations such as precipitation, extraction, and distillation. Identification may be based on differences in color, odor, melting point, boiling point, solubility, radioactivity or reactivity. Classical quantitative analysis uses mass or volume changes to quantify amount. Instrumental methods may be used to separate samples using chromatography, electrophoresis or field flow fractionation. Then qualitative and quantitative analysis can be performed, often with ... [...More Info...] [...Related Items...] OR: [Wikipedia] [Google] [Baidu] |


