|
Kappa1 Lupi
Kappa1 Lupi is a solitary star in the southern constellation of Lupus. It is visible to the naked eye with an apparent visual magnitude of 3.86, and forms a double star with Kappa2 Lupi. Based upon an annual parallax shift of 18.12 mas as seen from Earth, it is located about 180 light years from the Sun. Both Kappa1 Lupi and its neighbor Kappa2 Lupi are members of the Hyades Stream, which is a moving group that is coincident with the proper motions of the Hyades cluster. This is a B-type main sequence star with a stellar classification of B9.5 Vne. The 'n' suffix indicates the spectrum shows "nebulous" absorption lines due to rapid rotation, while the 'e' means this is a Be star that displays Balmer series emission lines. With an estimated age of 195 million years, it is about 75% of the way through its life span on the main sequence. The star is rotating with a projected rotational velocity of 191 km/s. This rate of spin is giving the star an oblat ... [...More Info...] [...Related Items...] OR: [Wikipedia] [Google] [Baidu] |
J2000
In astronomy, an epoch or reference epoch is a moment in time used as a reference point for some time-varying astronomical quantity. It is useful for the celestial coordinates or orbital elements of a celestial body, as they are subject to perturbations and vary with time. These time-varying astronomical quantities might include, for example, the mean longitude or mean anomaly of a body, the node of its orbit relative to a reference plane, the direction of the apogee or aphelion of its orbit, or the size of the major axis of its orbit. The main use of astronomical quantities specified in this way is to calculate other relevant parameters of motion, in order to predict future positions and velocities. The applied tools of the disciplines of celestial mechanics or its subfield orbital mechanics (for predicting orbital paths and positions for bodies in motion under the gravitational effects of other bodies) can be used to generate an ephemeris, a table of values giving the positions ... [...More Info...] [...Related Items...] OR: [Wikipedia] [Google] [Baidu] |
Hyades Stream
The Hyades Stream (or Hyades moving group) is a large collection of scattered stars that also share a similar trajectory with the Hyades Cluster. In 1869, Richard A. Proctor observed that numerous stars at large distances from the Hyades share a similar motion through space. In 1908, Lewis Boss reported almost 25 years of observations to support this premise, arguing for the existence of a co-moving group of stars that he called the Taurus Stream (now generally known as the Hyades Stream or, following Olin J. Eggen who assumed that it was a vestige of an initially more massive cluster which had partly evaporated, the Hyades Supercluster). Boss published a chart that traced the scattered stars' movements back to a common point of convergence. Eggen's argument that groups of this type are in fact cluster remnants has been debated. It has been noted that because such phenomena may also be the result of other dynamical mechanisms. Famaey B, ''et al.'' report that about 85% of stars ... [...More Info...] [...Related Items...] OR: [Wikipedia] [Google] [Baidu] |
Equatorial Bulge
An equatorial bulge is a difference between the equatorial and polar diameters of a planet, due to the centrifugal force exerted by the rotation about the body's axis. A rotating body tends to form an oblate spheroid rather than a sphere. On Earth The Earth has a rather slight equatorial bulge: it is about wider at the equator than pole-to-pole, a difference which is about 1/298 of the equatorial diameter. If the Earth were scaled down to a globe with diameter of 1 meter at the equator, that difference would be only 3 millimeters. While too small to notice visually, that difference is still more than twice the largest deviations of the actual surface from the ellipsoid, including the tallest mountains and deepest oceanic trenches. The rotation of the earth also affects the sea level, the imaginary surface that is used to measure altitudes from. This surface coincides with the mean water surface level in oceans, and is extrapolated over land by taking into account the local g ... [...More Info...] [...Related Items...] OR: [Wikipedia] [Google] [Baidu] |
Oblate Spheroid
A spheroid, also known as an ellipsoid of revolution or rotational ellipsoid, is a quadric surface obtained by rotating an ellipse about one of its principal axes; in other words, an ellipsoid with two equal semi-diameters. A spheroid has circular symmetry. If the ellipse is rotated about its major axis, the result is a ''prolate spheroid'', elongated like a rugby ball. The American football is similar but has a pointier end than a spheroid could. If the ellipse is rotated about its minor axis, the result is an ''oblate spheroid'', flattened like a lentil or a plain M&M. If the generating ellipse is a circle, the result is a sphere. Due to the combined effects of gravity and rotation, the figure of the Earth (and of all planets) is not quite a sphere, but instead is slightly flattened in the direction of its axis of rotation. For that reason, in cartography and geodesy the Earth is often approximated by an oblate spheroid, known as the reference ellipsoid, instead of a ... [...More Info...] [...Related Items...] OR: [Wikipedia] [Google] [Baidu] |
Projected Rotational Velocity
Stellar rotation is the angular motion of a star about its axis. The rate of rotation can be measured from the spectrum of the star, or by timing the movements of active features on the surface. The rotation of a star produces an equatorial bulge due to centrifugal force. As stars are not solid bodies, they can also undergo differential rotation. Thus the equator of the star can rotate at a different angular velocity than the higher latitudes. These differences in the rate of rotation within a star may have a significant role in the generation of a stellar magnetic field. The magnetic field of a star interacts with the stellar wind. As the wind moves away from the star its rate of angular velocity slows. The magnetic field of the star interacts with the wind, which applies a drag to the stellar rotation. As a result, angular momentum is transferred from the star to the wind, and over time this gradually slows the star's rate of rotation. Measurement Unless a star is being obs ... [...More Info...] [...Related Items...] OR: [Wikipedia] [Google] [Baidu] |
Main Sequence
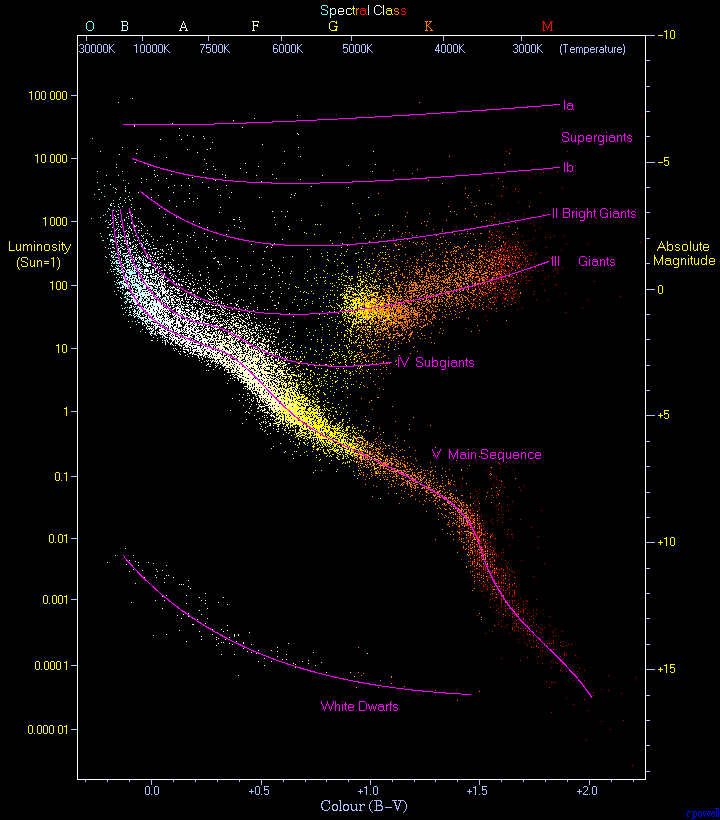
In astronomy, the main sequence is a continuous and distinctive band of stars that appears on plots of stellar color versus brightness. These color-magnitude plots are known as Hertzsprung–Russell diagrams after their co-developers, Ejnar Hertzsprung and Henry Norris Russell. Stars on this band are known as main-sequence stars or dwarf stars. These are the most numerous true stars in the universe and include the Sun. After condensation and ignition of a star, it generates thermal energy in its dense core region through nuclear fusion of hydrogen into helium. During this stage of the star's lifetime, it is located on the main sequence at a position determined primarily by its mass but also based on its chemical composition and age. The cores of main-sequence stars are in hydrostatic equilibrium, where outward thermal pressure from the hot core is balanced by the inward pressure of gravitational collapse from the overlying layers. The strong dependence of the rate of energy ge ... [...More Info...] [...Related Items...] OR: [Wikipedia] [Google] [Baidu] |
Balmer Series
The Balmer series, or Balmer lines in atomic physics, is one of a set of six named series describing the spectral line emissions of the hydrogen atom. The Balmer series is calculated using the Balmer formula, an empirical equation discovered by Johann Balmer in 1885. The visible spectrum of light from hydrogen displays four wavelengths, 410 nm, 434 nm, 486 nm, and 656 nm, that correspond to emissions of photons by electrons in excited states transitioning to the quantum level described by the principal quantum number ''n'' equals 2. There are several prominent ultraviolet Balmer lines with wavelengths shorter than 400 nm. The number of these lines is an infinite continuum as it approaches a limit of 364.5 nm in the ultraviolet. After Balmer's discovery, five other hydrogen spectral series were discovered, corresponding to electrons transitioning to values of ''n'' other than two . Overview The Balmer series is characterized by the electron t ... [...More Info...] [...Related Items...] OR: [Wikipedia] [Google] [Baidu] |
Be Star
Be stars are a heterogeneous set of stars with B spectral types and emission lines. A narrower definition, sometimes referred to as ''classical Be stars'', is a non-supergiant B star whose spectrum has, or had at some time, one or more Balmer emission lines. Definition and classification Many stars have B-type spectra and show hydrogen emission lines, including many supergiants, Herbig Ae/Be stars, mass-transferring binary systems, and B stars. It is preferred to restrict usage of the term Be star to non-supergiant stars showing one or more Balmer series lines in emission. These are sometimes referred to as classical Be stars. The emission lines may be present only at certain times. Although the Be type spectrum is most strongly produced in class B stars, it is also detected in O and A shell stars, and these are sometimes included under the "Be star" banner. Be stars are primarily considered to be main sequence stars, but a number of subgiants and giant stars are also ... [...More Info...] [...Related Items...] OR: [Wikipedia] [Google] [Baidu] |
Absorption Line
A spectral line is a dark or bright line in an otherwise uniform and continuous spectrum, resulting from emission or absorption of light in a narrow frequency range, compared with the nearby frequencies. Spectral lines are often used to identify atoms and molecules. These "fingerprints" can be compared to the previously collected ones of atoms and molecules, and are thus used to identify the atomic and molecular components of stars and planets, which would otherwise be impossible. Types of line spectra Spectral lines are the result of interaction between a quantum system (usually atoms, but sometimes molecules or atomic nuclei) and a single photon. When a photon has about the right amount of energy (which is connected to its frequency) to allow a change in the energy state of the system (in the case of an atom this is usually an electron changing orbitals), the photon is absorbed. Then the energy will be spontaneously re-emitted, either as one photon at the same frequency ... [...More Info...] [...Related Items...] OR: [Wikipedia] [Google] [Baidu] |
Spectrum
A spectrum (plural ''spectra'' or ''spectrums'') is a condition that is not limited to a specific set of values but can vary, without gaps, across a continuum. The word was first used scientifically in optics to describe the rainbow of colors in visible light after passing through a prism. As scientific understanding of light advanced, it came to apply to the entire electromagnetic spectrum. It thereby became a mapping of a range of magnitudes (wavelengths) to a range of qualities, which are the perceived "colors of the rainbow" and other properties which correspond to wavelengths that lie outside of the visible light spectrum. Spectrum has since been applied by analogy to topics outside optics. Thus, one might talk about the " spectrum of political opinion", or the "spectrum of activity" of a drug, or the " autism spectrum". In these uses, values within a spectrum may not be associated with precisely quantifiable numbers or definitions. Such uses imply a broad range of co ... [...More Info...] [...Related Items...] OR: [Wikipedia] [Google] [Baidu] |
Stellar Classification
In astronomy, stellar classification is the classification of stars based on their spectral characteristics. Electromagnetic radiation from the star is analyzed by splitting it with a prism or diffraction grating into a spectrum exhibiting the rainbow of colors interspersed with spectral lines. Each line indicates a particular chemical element or molecule, with the line strength indicating the abundance of that element. The strengths of the different spectral lines vary mainly due to the temperature of the photosphere, although in some cases there are true abundance differences. The ''spectral class'' of a star is a short code primarily summarizing the ionization state, giving an objective measure of the photosphere's temperature. Most stars are currently classified under the Morgan–Keenan (MK) system using the letters ''O'', ''B'', ''A'', ''F'', ''G'', ''K'', and ''M'', a sequence from the hottest (''O'' type) to the coolest (''M'' type). Each letter class is then subdivi ... [...More Info...] [...Related Items...] OR: [Wikipedia] [Google] [Baidu] |
B-type Main Sequence Star
A B-type main-sequence star (B V) is a main-sequence (hydrogen-burning) star of spectral type B and luminosity class V. These stars have from 2 to 16 times the mass of the Sun and surface temperatures between 10,000 and 30,000 K. B-type stars are extremely luminous and blue. Their spectra have neutral helium, which are most prominent at the B2 subclass, and moderate hydrogen lines. Examples include Regulus and Algol A. This class of stars was introduced with the Harvard sequence of stellar spectra and published in the ''Revised Harvard photometry'' catalogue. The definition of type B-type stars was the presence of non-ionized helium lines with the absence of singly ionized helium in the blue-violet portion of the spectrum. All of the spectral classes, including the B type, were subdivided with a numerical suffix that indicated the degree to which they approached the next classification. Thus B2 is 1/5 of the way from type B (or B0) to type A. Later, however, more refined sp ... [...More Info...] [...Related Items...] OR: [Wikipedia] [Google] [Baidu] |


