|
Area Chart
An area chart or area graph displays graphically quantitative data. It is based on the line chart. The area between axis and line are commonly emphasized with colors, textures and hatchings. Commonly one compares two or more quantities with an area chart. History William Playfair is usually credited with inventing the area charts as well as the line, bar, and pie charts. His book ''The Commercial and Political Atlas'', published in 1786, contained a number of time-series graphs, including ''Interest of the National Debt from the Revolution'' and ''Chart of all the Imports and Exports to and from England from the Year 1700 to 1782'' that are often described as the first area charts in history. Common uses Area charts are used to represent cumulated totals using numbers or percentages (stacked area charts in this case) over time. Use the area chart for showing trends over time among related attributes. The area chart is like the plot chart except that the area below the ... [...More Info...] [...Related Items...] OR: [Wikipedia] [Google] [Baidu] |
US And USSR Nuclear Stockpiles
US or Us most often refers to: * ''Us'' (pronoun), the objective case of the English first-person plural pronoun ''we'' * US, an abbreviation for the United States US, U.S., Us, us, or u.s. may also refer to: Arts and entertainment Albums * ''Us'' (Brother Ali album) or the title song, 2009 * ''Us'' (Empress Of album), 2018 * ''Us'' (Mull Historical Society album), 2003 * ''Us'' (Peter Gabriel album), 1992 * ''Us'' (EP), by Moon Jong-up, 2021 * ''Us'', by Maceo Parker, 1974 * ''Us'', mini-album by Peakboy, 2019 Songs * "Us" (James Bay song), 2018 * "Us" (Jennifer Lopez song), 2018 * "Us" (Regina Spektor song), 2004 * "Us" (Gracie Abrams song), 2024 * "Us", by Azealia Banks from '' Fantasea'', 2012 * "Us", by Celine Dion from ''Let's Talk About Love'', 1997 * "Us", by Gucci Mane from '' Delusions of Grandeur'', 2019 * "Us", by Spoon from '' Hot Thoughts'', 2017 Other media * US Festival, two 1980s California music festivals organized by Steve Wozniak * ''Us'' (1991 ... [...More Info...] [...Related Items...] OR: [Wikipedia] [Google] [Baidu] |
Line Chart
A line chart or line graph, also known as curve chart, is a type of chart that displays information as a series of data points called 'markers' connected by straight wikt:line, line segments. It is a basic type of chart common in many fields. It is similar to a scatter plot except that the measurement points are ordered (typically by their x-axis value) and joined with straight line segments. A line chart is often used to visualize a trend in data over intervals of time – a time series – thus the line is often drawn chronologically. In these cases they are known as run charts. History Some of the earliest known line charts are generally credited to Francis Hauksbee, Nicolaus Samuel Cruquius, Johann Heinrich Lambert and the Scottish engineer William Playfair. Line charts often display time as a variable on the x-axis. Playfair was one of the first to visualize data this way. In 1786, he plotted ten years of money spent by the Royal Navy. He supplemented the chart with a det ... [...More Info...] [...Related Items...] OR: [Wikipedia] [Google] [Baidu] |
William Playfair
William Playfair (22 September 1759 – 11 February 1823) was a Scottish engineer and political economist. The founder of graphical methods of statistics, Playfair invented several types of diagrams: in 1786 he introduced the line, area and bar chart of economic data, and in 1801 he published what were likely the first pie chart and circle graph, used to show part-whole relations. Playfair has been reported to have been a secret agent for the British Government, although this is a subject of controversy. Biography William Playfair was born in 1759 in Scotland. He was the fourth son (named after his grandfather) of the Reverend James Playfair of the parish of Liff & Benvie near the city of Dundee in Scotland; his notable brothers were architect James Playfair and mathematician John Playfair. His father died in 1772 when he was 13, leaving the eldest brother John to care for the family and his education. After his apprenticeship with Andrew Meikle, the inventor of the thre ... [...More Info...] [...Related Items...] OR: [Wikipedia] [Google] [Baidu] |
Line Chart
A line chart or line graph, also known as curve chart, is a type of chart that displays information as a series of data points called 'markers' connected by straight wikt:line, line segments. It is a basic type of chart common in many fields. It is similar to a scatter plot except that the measurement points are ordered (typically by their x-axis value) and joined with straight line segments. A line chart is often used to visualize a trend in data over intervals of time – a time series – thus the line is often drawn chronologically. In these cases they are known as run charts. History Some of the earliest known line charts are generally credited to Francis Hauksbee, Nicolaus Samuel Cruquius, Johann Heinrich Lambert and the Scottish engineer William Playfair. Line charts often display time as a variable on the x-axis. Playfair was one of the first to visualize data this way. In 1786, he plotted ten years of money spent by the Royal Navy. He supplemented the chart with a det ... [...More Info...] [...Related Items...] OR: [Wikipedia] [Google] [Baidu] |
Bar Chart
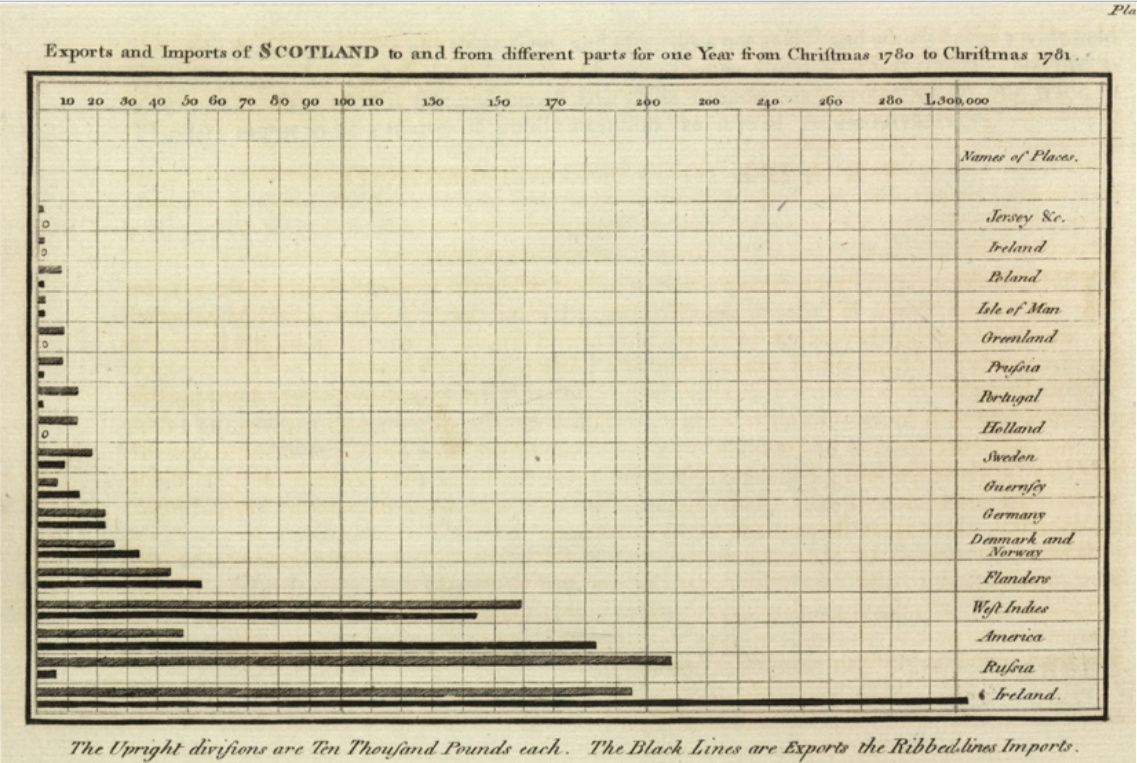
A bar chart or bar graph is a chart or graph that presents categorical variable, categorical data with rectangular bars with heights or lengths proportional to the values that they represent. The bars can be plotted vertically or horizontally. A vertical bar chart is sometimes called a column chart and has been identified as the prototype of charts. A bar graph shows comparisons among discrete variable, discrete categorical variable, categories. One axis of the chart shows the specific categories being compared, and the other axis represents a measured value. Some bar graphs present bars clustered or stacked in groups of more than one, showing the values of more than one measured variable. History Many sources consider William Playfair (1759-1824) to have invented the bar chart and the ''Exports and Imports of Scotland to and from different parts for one Year from Christmas 1780 to Christmas 1781'' graph from his ''The Commercial and Political Atlas'' to be the first bar chart ... [...More Info...] [...Related Items...] OR: [Wikipedia] [Google] [Baidu] |
Pie Chart
A pie chart (or a circle chart) is a circular Statistical graphics, statistical graphic which is divided into slices to illustrate numerical proportion. In a pie chart, the arc length of each slice (and consequently its central angle and area) is Proportionality (mathematics), proportional to the quantity it represents. While it is named for its resemblance to a pie which has been sliced, there are variations on the way it can be presented. The earliest known pie chart is generally credited to William Playfair's ''Statistical Breviary'' of 1801.Spence (2005)Tufte, p. 44 Pie charts are very widely used in the business world and the mass media.Cleveland, p. 262 However, they have been criticized,Wilkinson, p. 23. and many experts recommend avoiding them,Tufte, p. 178.van Belle, p. 160–162.Stephen Few"Save the Pies for Dessert" August 2007, Retrieved 2010-02-02Steve Fento"Pie Charts Are Bad"/ref> as research has shown it is more difficult to make simple comparisons such as the si ... [...More Info...] [...Related Items...] OR: [Wikipedia] [Google] [Baidu] |
Time-series
In mathematics, a time series is a series of data points indexed (or listed or graphed) in time order. Most commonly, a time series is a sequence taken at successive equally spaced points in time. Thus it is a sequence of discrete-time data. Examples of time series are heights of ocean tides, counts of sunspots, and the daily closing value of the Dow Jones Industrial Average. A time series is very frequently plotted via a run chart (which is a temporal line chart). Time series are used in statistics, signal processing, pattern recognition, econometrics, mathematical finance, weather forecasting, earthquake prediction, electroencephalography, control engineering, astronomy, communications engineering, and largely in any domain of applied science and engineering which involves temporal measurements. Time series ''analysis'' comprises methods for analyzing time series data in order to extract meaningful statistics and other characteristics of the data. Time series ''forecastin ... [...More Info...] [...Related Items...] OR: [Wikipedia] [Google] [Baidu] |
Streamgraph
A streamgraph, or stream graph, is a type of stacked area chart, area graph which is displaced around a Cartesian coordinate system, central axis, resulting in a flowing, organic shape. Unlike a traditional stacked area graph in which the layers are stacked on top of an axis, in a streamgraph the layers are positioned to minimize their "wiggle". More formally, the layers are displaced to minimize the sum of the squared slopes of each layer, weighted by the area of the layer. Streamgraphs display data with only positive values, and are not able to represent both negative and positive values. Streamgraphs and their use were popularized by Amanda Cox in a February 2008 ''New York Times'' article on movie box office revenues. Cox got the idea from then-undergraduate Lee Byron, who had used a similar method for visualizing his music listening history. A related graph, sometimes conflated with streamgraphs, is the ThemeRiver, in which the "silhouette" of the graph is symmetrically arra ... [...More Info...] [...Related Items...] OR: [Wikipedia] [Google] [Baidu] |
Diagrams
A diagram is a symbolic representation of information using visualization techniques. Diagrams have been used since prehistoric times on walls of caves, but became more prevalent during the Enlightenment. Sometimes, the technique uses a three-dimensional visualization which is then projected onto a two-dimensional surface. The word '' graph'' is sometimes used as a synonym for diagram. Overview The term "diagram" in its commonly used sense can have a general or specific meaning: * ''visual information device'' : Like the term "illustration", "diagram" is used as a collective term standing for the whole class of technical genres, including graphs, technical drawings and tables. * ''specific kind of visual display'' : This is the genre that shows qualitative data with shapes that are connected by lines, arrows, or other visual links. In science the term is used in both ways. For example, Anderson (1997) stated more generally: "diagrams are pictorial, yet abstract, represen ... [...More Info...] [...Related Items...] OR: [Wikipedia] [Google] [Baidu] |


