|
T-tests
Student's ''t''-test is a statistical test used to test whether the difference between the response of two groups is statistically significant or not. It is any statistical hypothesis test in which the test statistic follows a Student's ''t''-distribution under the null hypothesis. It is most commonly applied when the test statistic would follow a normal distribution if the value of a scaling term in the test statistic were known (typically, the scaling term is unknown and is therefore a nuisance parameter). When the scaling term is estimated based on the data, the test statistic—under certain conditions—follows a Student's ''t'' distribution. The ''t''-test's most common application is to test whether the means of two populations are significantly different. In many cases, a ''Z''-test will yield very similar results to a ''t''-test because the latter converges to the former as the size of the dataset increases. History The term "''t''-statistic" is abbreviated from "hypo ... [...More Info...] [...Related Items...] OR: [Wikipedia] [Google] [Baidu] |
Normal Distribution
In probability theory and statistics, a normal distribution or Gaussian distribution is a type of continuous probability distribution for a real-valued random variable. The general form of its probability density function is f(x) = \frac e^\,. The parameter is the mean or expectation of the distribution (and also its median and mode), while the parameter \sigma^2 is the variance. The standard deviation of the distribution is (sigma). A random variable with a Gaussian distribution is said to be normally distributed, and is called a normal deviate. Normal distributions are important in statistics and are often used in the natural and social sciences to represent real-valued random variables whose distributions are not known. Their importance is partly due to the central limit theorem. It states that, under some conditions, the average of many samples (observations) of a random variable with finite mean and variance is itself a random variable—whose distribution c ... [...More Info...] [...Related Items...] OR: [Wikipedia] [Google] [Baidu] |
Statistical Significance
In statistical hypothesis testing, a result has statistical significance when a result at least as "extreme" would be very infrequent if the null hypothesis were true. More precisely, a study's defined significance level, denoted by \alpha, is the probability of the study rejecting the null hypothesis, given that the null hypothesis is true; and the p-value, ''p''-value of a result, ''p'', is the probability of obtaining a result at least as extreme, given that the null hypothesis is true. The result is said to be ''statistically significant'', by the standards of the study, when p \le \alpha. The significance level for a study is chosen before data collection, and is typically set to 5% or much lower—depending on the field of study. In any experiment or Observational study, observation that involves drawing a Sampling (statistics), sample from a Statistical population, population, there is always the possibility that an observed effect would have occurred due to sampling error al ... [...More Info...] [...Related Items...] OR: [Wikipedia] [Google] [Baidu] |
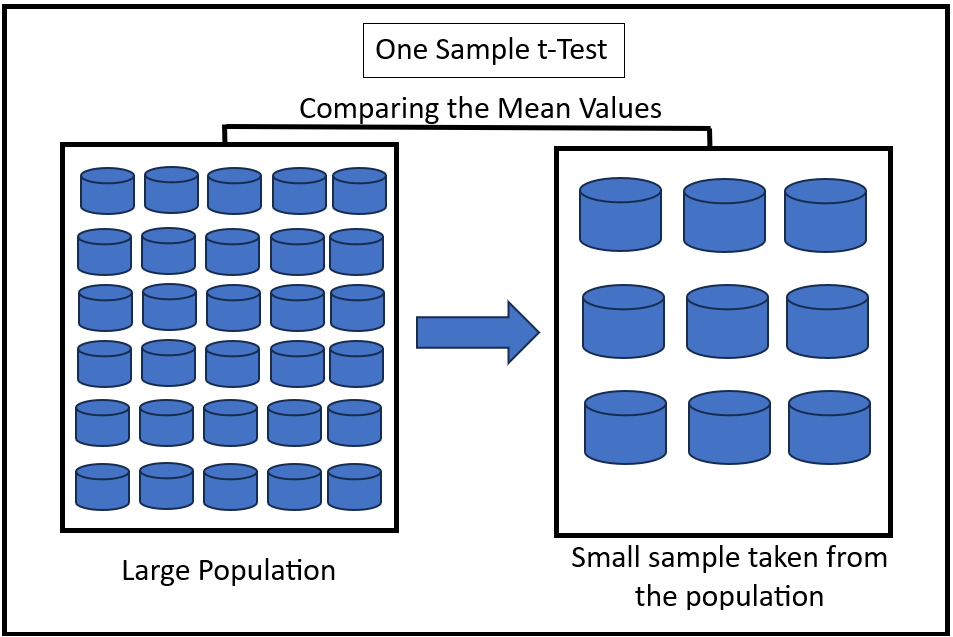
One Sample T-test
Student's ''t''-test is a statistical test used to test whether the difference between the response of two groups is Statistical significance, statistically significant or not. It is any statistical hypothesis testing, statistical hypothesis test in which the test statistic follows a Student's t-distribution, Student's ''t''-distribution under the null hypothesis. It is most commonly applied when the test statistic would follow a normal distribution if the value of a Scale parameter, scaling term in the test statistic were known (typically, the scaling term is unknown and is therefore a nuisance parameter). When the scaling term is estimated based on the data, the test statistic—under certain conditions—follows a Student's ''t'' distribution. The ''t''-test's most common application is to test whether the means of two populations are significantly different. In many cases, a Z-test, ''Z''-test will yield very similar results to a ''t''-test because the latter converges to the fo ... [...More Info...] [...Related Items...] OR: [Wikipedia] [Google] [Baidu] |
Statistical Test
A statistical hypothesis test is a method of statistical inference used to decide whether the data provide sufficient evidence to reject a particular hypothesis. A statistical hypothesis test typically involves a calculation of a test statistic. Then a decision is made, either by comparing the test statistic to a critical value or equivalently by evaluating a ''p''-value computed from the test statistic. Roughly 100 specialized statistical tests are in use and noteworthy. History While hypothesis testing was popularized early in the 20th century, early forms were used in the 1700s. The first use is credited to John Arbuthnot (1710), followed by Pierre-Simon Laplace (1770s), in analyzing the human sex ratio at birth; see . Choice of null hypothesis Paul Meehl has argued that the epistemological importance of the choice of null hypothesis has gone largely unacknowledged. When the null hypothesis is predicted by theory, a more precise experiment will be a more severe tes ... [...More Info...] [...Related Items...] OR: [Wikipedia] [Google] [Baidu] |
Degrees Of Freedom (statistics)
In statistics, the number of degrees of freedom is the number of values in the final calculation of a statistic that are free to vary. Estimates of statistical parameters can be based upon different amounts of information or data. The number of independent pieces of information that go into the estimate of a parameter is called the degrees of freedom. In general, the degrees of freedom of an estimate of a parameter are equal to the number of independent scores that go into the estimate minus the number of parameters used as intermediate steps in the estimation of the parameter itself. For example, if the variance is to be estimated from a random sample of N independent scores, then the degrees of freedom is equal to the number of independent scores (''N'') minus the number of parameters estimated as intermediate steps (one, namely, the sample mean) and is therefore equal to N-1. Mathematically, degrees of freedom is the number of dimensions of the domain of a random vector, or e ... [...More Info...] [...Related Items...] OR: [Wikipedia] [Google] [Baidu] |
Standard Deviation
In statistics, the standard deviation is a measure of the amount of variation of the values of a variable about its Expected value, mean. A low standard Deviation (statistics), deviation indicates that the values tend to be close to the mean (also called the expected value) of the set, while a high standard deviation indicates that the values are spread out over a wider range. The standard deviation is commonly used in the determination of what constitutes an outlier and what does not. Standard deviation may be abbreviated SD or std dev, and is most commonly represented in mathematical texts and equations by the lowercase Greek alphabet, Greek letter Sigma, σ (sigma), for the population standard deviation, or the Latin script, Latin letter ''s'', for the sample standard deviation. The standard deviation of a random variable, Sample (statistics), sample, statistical population, data set, or probability distribution is the square root of its variance. (For a finite population, v ... [...More Info...] [...Related Items...] OR: [Wikipedia] [Google] [Baidu] |
Location Test
A location test is a statistical hypothesis test that compares the location parameter of a statistical population to a given constant, or that compares the location parameters of two statistical populations to each other. Most commonly, the location parameter (or parameters) of interest are expected values, but location tests based on median The median of a set of numbers is the value separating the higher half from the lower half of a Sample (statistics), data sample, a statistical population, population, or a probability distribution. For a data set, it may be thought of as the “ ...s or other measures of location are also used. One-sample location test The one-sample location test compares the location parameter of one sample to a given constant. An example of a one-sample location test would be a comparison of the location parameter for the blood pressure distribution of a population to a given reference value. In a one-sided test, it is stated before the analysis is car ... [...More Info...] [...Related Items...] OR: [Wikipedia] [Google] [Baidu] |
Pediatrics (journal)
''Pediatrics'' is a monthly peer-reviewed medical journal published by the American Academy of Pediatrics. In the inaugural January 1948 issue, the journal's first editor-in-chief, Hugh McCulloch, articulated the journal's vision: "The content of the journal is... intended to encompass the needs of the whole child in his physiologic, mental, emotional, and social structure. The single word, Pediatrics, has been chosen to indicate this catholic intent." According to the ''Journal Citation Reports'', the journal has a 2022 impact factor The impact factor (IF) or journal impact factor (JIF) of an academic journal is a type of journal ranking. Journals with higher impact factor values are considered more prestigious or important within their field. The Impact Factor of a journa ... of 8.0. Editors The following persons are or have been editor-in-chief: *1948–1954 Hugh McCulloch *1954–1961 Charles D. May *1962–1974 Clement A. Smith *1974–2009 Jerold F. Lucey *2009–pre ... [...More Info...] [...Related Items...] OR: [Wikipedia] [Google] [Baidu] |
University College London
University College London (Trade name, branded as UCL) is a Public university, public research university in London, England. It is a Member institutions of the University of London, member institution of the Federal university, federal University of London, and is the second-largest list of universities in the United Kingdom by enrolment, university in the United Kingdom by total enrolment and the largest by postgraduate enrolment. Established in 1826 as London University (though without university degree-awarding powers) by founders who were inspired by the radical ideas of Jeremy Bentham, UCL was the first university institution to be established in London, and the first in England to be entirely secular and to admit students regardless of their religion. It was also, in 1878, among the first university colleges to admit women alongside men, two years after University College, Bristol, had done so. Intended by its founders to be Third-oldest university in England debate ... [...More Info...] [...Related Items...] OR: [Wikipedia] [Google] [Baidu] |
Stout
Stout is a type of dark beer that is generally warm fermented, such as dry stout, oatmeal stout, milk stout and imperial stout. Stout is a type of ale. The first known use of the word "stout" for beer is in a document dated 1677 in the Egerton Manuscripts, referring to its strength. Porters were brewed to a variety of strengths, with the stronger beers called "stout porters". The history and development of stout and porter are thus intertwined.''The New Oxford Dictionary of English''. Oxford University Press 1998 Porter and Stout – CAMRA Web.archive.org History Porter originated in London, England in the early 1720s. The beer became popular in the city, especia ...[...More Info...] [...Related Items...] OR: [Wikipedia] [Google] [Baidu] |
Ronald Fisher
Sir Ronald Aylmer Fisher (17 February 1890 – 29 July 1962) was a British polymath who was active as a mathematician, statistician, biologist, geneticist, and academic. For his work in statistics, he has been described as "a genius who almost single-handedly created the foundations for modern statistical science" and "the single most important figure in 20th century statistics". In genetics, Fisher was the one to most comprehensively combine the ideas of Gregor Mendel and Charles Darwin, as his work used mathematics to combine Mendelian genetics and natural selection; this contributed to the revival of Darwinism in the early 20th-century revision of the theory of evolution known as the Modern synthesis (20th century), modern synthesis. For his contributions to biology, Richard Dawkins declared Fisher to be the greatest of Darwin's successors. He is also considered one of the founding fathers of Neo-Darwinism. According to statistician Jeffrey T. Leek, Fisher is the most in ... [...More Info...] [...Related Items...] OR: [Wikipedia] [Google] [Baidu] |


