|
Plate Carrée Projection
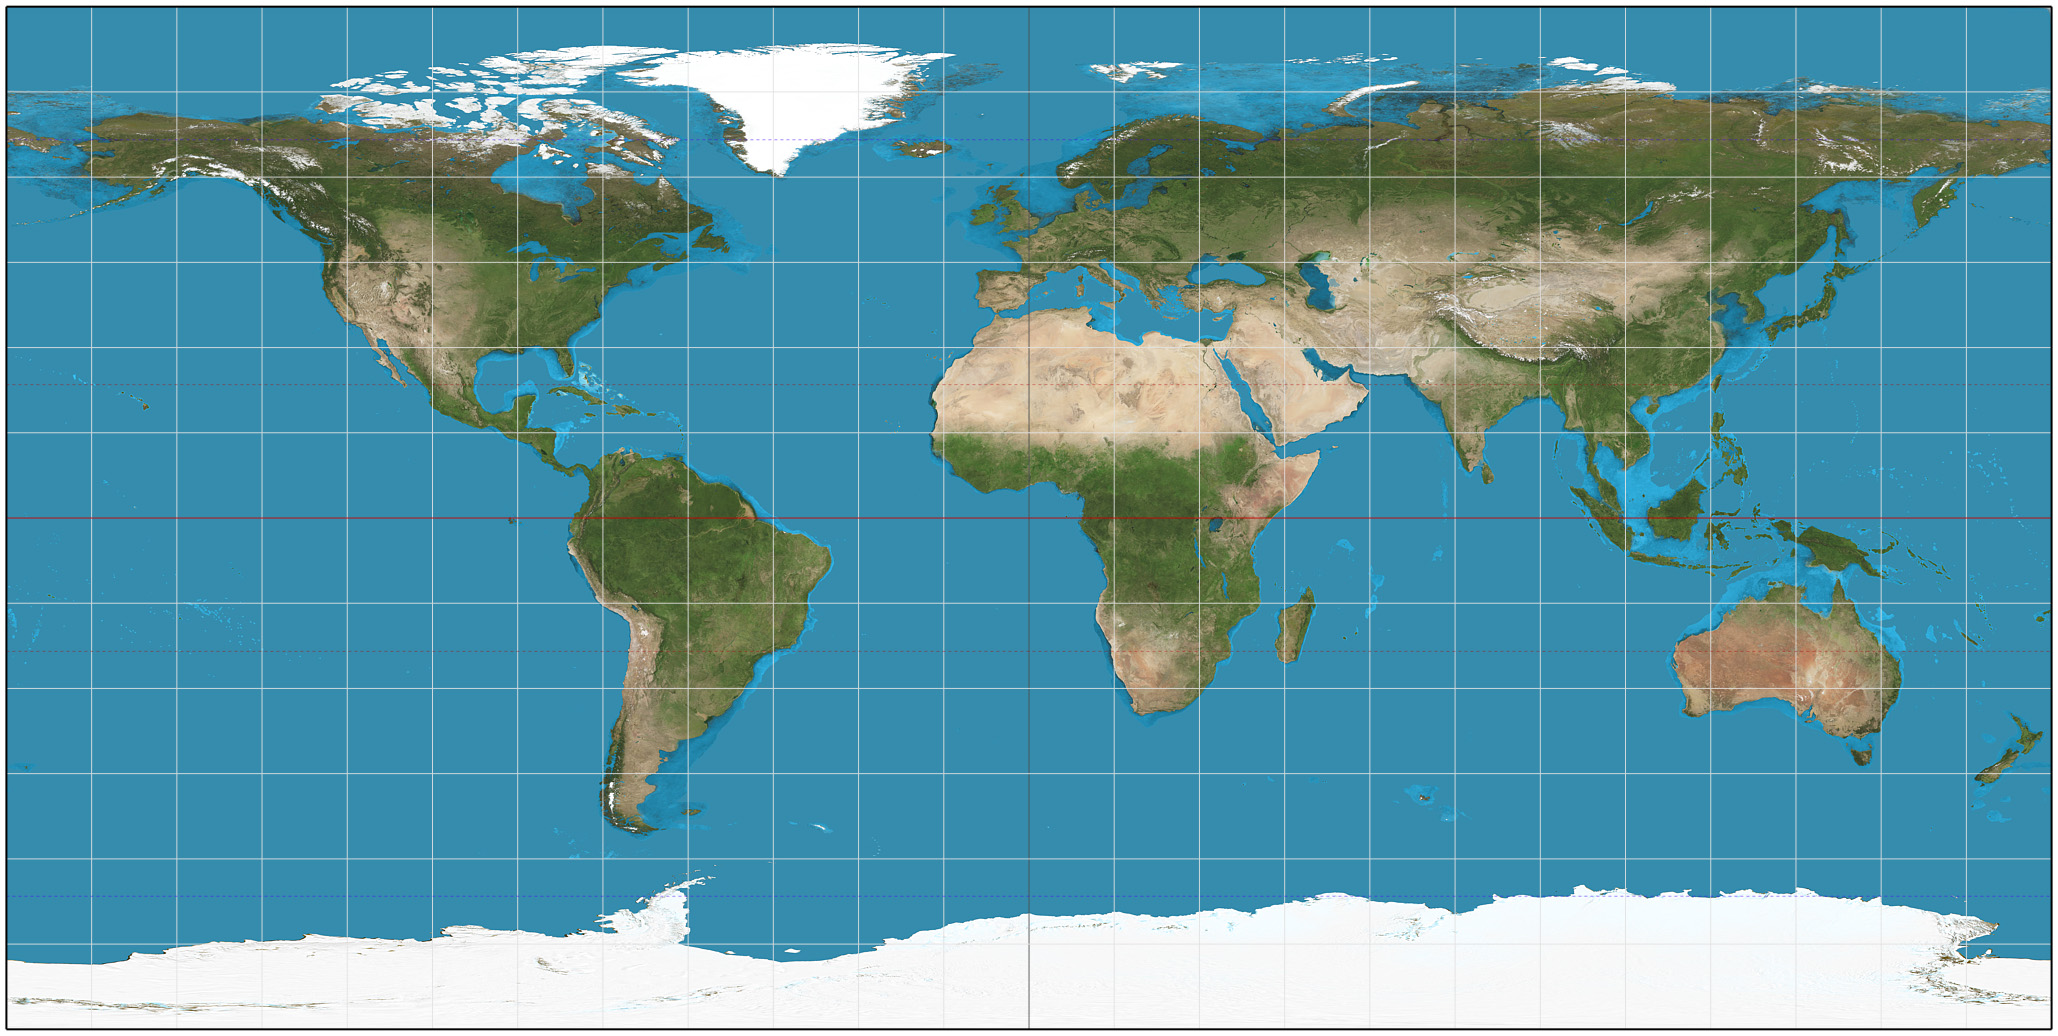
The equirectangular projection (also called the equidistant cylindrical projection or la carte parallélogrammatique projection), and which includes the special case of the plate carrée projection (also called the geographic projection, lat/lon projection, or plane chart), is a simple map projection attributed to Marinus of Tyre who, Ptolemy claims, invented the projection about AD 100. The projection maps meridians to vertical straight lines of constant spacing (for meridional intervals of constant spacing), and circles of latitude to horizontal straight lines of constant spacing (for constant intervals of parallels). The projection is neither equal area nor conformal. Because of the distortions introduced by this projection, it has little use in navigation or cadastral mapping and finds its main use in thematic mapping. In particular, the plate carrée has become a standard for global raster datasets, such as Celestia, NASA World Wind, the USGS Astrogeology Researc ... [...More Info...] [...Related Items...] OR: [Wikipedia] [Google] [Baidu] |
NASA World Wind
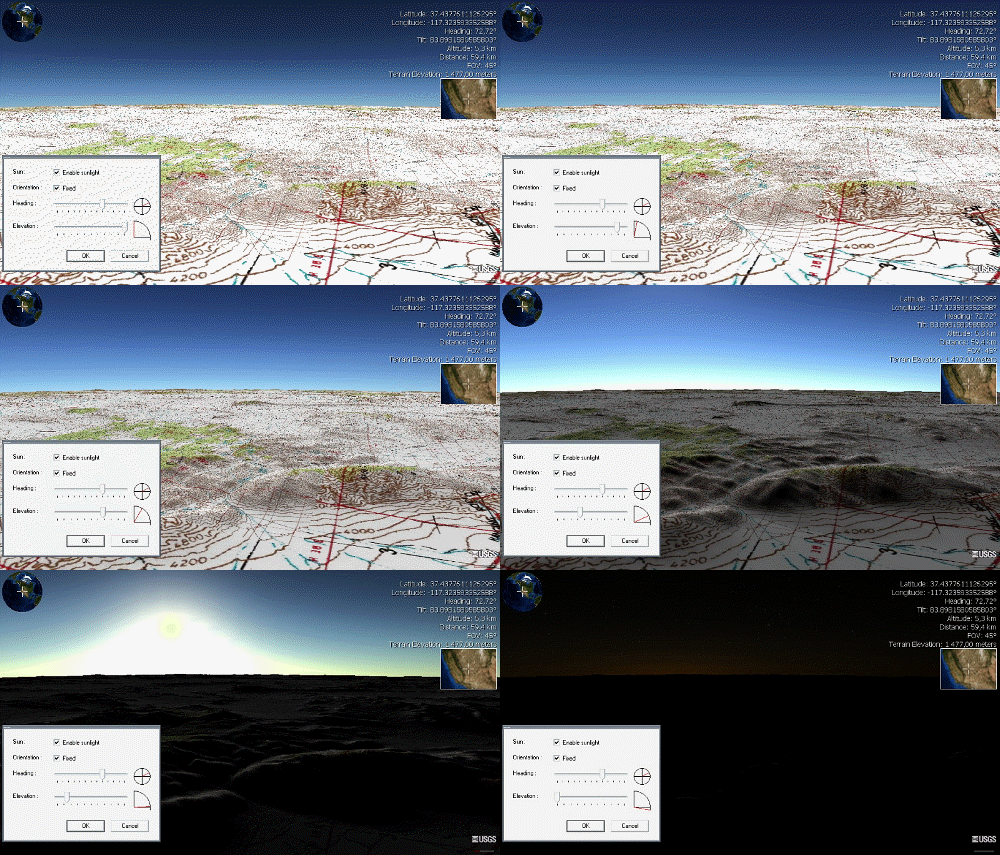
NASA WorldWind is an open-source (released under the NOSA license and the Apache 2.0 license) virtual globe. According to the website, "WorldWind is an open source virtual globe API. WorldWind allows developers to quickly and easily create interactive visualizations of 3D globe, map and geographical information. Organizations around the world use WorldWind to monitor weather patterns, visualize cities and terrain, track vehicle movement, analyze geospatial data and educate humanity about the Earth." It was first developed by NASA in 2003 for use on personal computers and then further developed in concert with the open source community since 2004. a web-based version of WorldWind is available online. An Android version is also available. The original version relied on .NET Framework, which ran only on Microsoft Windows. The more recent Java version, WorldWind Java, is cross platform, a software development kit (SDK) aimed at developers and, unlike the old .NET ver ... [...More Info...] [...Related Items...] OR: [Wikipedia] [Google] [Baidu] |
List Of Map Projections
This is a summary of map projections that have articles of their own on Wikipedia or that are otherwise WP:NOTABLE, notable. Because there is no limit to the number of possible map projections, there can be no comprehensive list. Table of projections *The first known popularizer/user and not necessarily the creator. Key Type of projection surface ; Cylindrical: In normal aspect, these map regularly-spaced meridians to equally spaced vertical lines, and parallels to horizontal lines. ; Pseudocylindrical: In normal aspect, these map the central meridian and parallels as straight lines. Other meridians are curves (or possibly straight from pole to equator), regularly spaced along parallels. ; Conic: In normal aspect, conic (or conical) projections map meridians as straight lines, and parallels as arcs of circles. ; Pseudoconical: In normal aspect, pseudoconical projections represent the central meridian as a straight line, other meridians as complex curves, and parallels as ci ... [...More Info...] [...Related Items...] OR: [Wikipedia] [Google] [Baidu] |
Gall–Peters Projection
The Gall–Peters projection is a rectangular, Equal-area projection, equal-area map projection. Like all equal-area projections, it distorts most shapes. It is a cylindrical equal-area projection with latitudes 45° north and south as the regions on the map that have no distortion. The projection is named after James Gall and Arno Peters. Gall described the projection in 1855 at a science convention and published a paper on it in 1885. Peters brought the projection to a wider audience beginning in the early 1970s through his "Peters World Map". The name "Gall–Peters projection" was first used by Arthur H. Robinson in a pamphlet put out by the American Cartographic Association in 1986.American Cartographic Association's Committee on Map Projections, 1986. ''Which Map is Best'' p. 12. Falls Church: American Congress on Surveying and Mapping. The Gall–Peters projection achieved notoriety in the late 20th century as the centerpiece of a controversy about the political implication ... [...More Info...] [...Related Items...] OR: [Wikipedia] [Google] [Baidu] |
Cassini Projection
The Cassini projection (also sometimes known as the Cassini–Soldner projection or Soldner projection) is a map projection first described in an approximate form by César-François Cassini de Thury in 1745. Its precise formulas were found through later analysis by Johann Georg von Soldner around 1810. It is the transverse aspect of the equirectangular projection, in that the globe is first rotated so the central meridian becomes the "equator", and then the normal equirectangular projection is applied. Considering the earth as a sphere, the projection is composed of the operations: :x = \arcsin(\cos \varphi \sin \lambda) \qquad y = \arctan\left(\frac\right). where ''λ'' is the longitude from the central meridian and ''φ'' is the latitude. When programming these equations, the inverse tangent function used is actually the atan2 function, with the first argument sin ''φ'' and the second . The reverse operation is composed of the operations: :\varphi = \arcsin(\sin ... [...More Info...] [...Related Items...] OR: [Wikipedia] [Google] [Baidu] |
Cartography
Cartography (; from , 'papyrus, sheet of paper, map'; and , 'write') is the study and practice of making and using maps. Combining science, aesthetics and technique, cartography builds on the premise that reality (or an imagined reality) can be modeled in ways that communicate spatial information effectively. The fundamental objectives of traditional cartography are to: * Set the map's agenda and select traits of the object to be mapped. This is the concern of map editing. Traits may be physical, such as roads or land masses, or may be abstract, such as toponyms or political boundaries. * Represent the terrain of the mapped object on flat media. This is the concern of map projections. * Eliminate the mapped object's characteristics that are irrelevant to the map's purpose. This is the concern of Cartographic generalization, generalization. * Reduce the complexity of the characteristics that will be mapped. This is also the concern of generalization. * Orchestrate the elements ... [...More Info...] [...Related Items...] OR: [Wikipedia] [Google] [Baidu] |
Gall Isographic Projection
Gall isographic projection is a specific instance of equirectangular projection such that its standard parallels are north and south 45°. The projection is named after James Gall, who presented it in 1855. See also *Gall–Peters projection *Gall stereographic projection Galls (from the Latin , 'oak-apple') or ''cecidia'' (from the Greek , anything gushing out) are a kind of swelling growth on the external tissues of plants. Plant galls are abnormal outgrowths of plant tissues, similar to benign tumors or war ... External links Gall Isographic Projection from Mathworks Cylindrical projections {{Cartography-stub ... [...More Info...] [...Related Items...] OR: [Wikipedia] [Google] [Baidu] |
French Language
French ( or ) is a Romance languages, Romance language of the Indo-European languages, Indo-European family. Like all other Romance languages, it descended from the Vulgar Latin of the Roman Empire. French evolved from Northern Old Gallo-Romance, a descendant of the Latin spoken in Northern Gaul. Its closest relatives are the other langues d'oïl—languages historically spoken in northern France and in southern Belgium, which French (Francien language, Francien) largely supplanted. It was also substratum (linguistics), influenced by native Celtic languages of Northern Roman Gaul and by the Germanic languages, Germanic Frankish language of the post-Roman Franks, Frankish invaders. As a result of French and Belgian colonialism from the 16th century onward, it was introduced to new territories in the Americas, Africa, and Asia, and numerous French-based creole languages, most notably Haitian Creole, were established. A French-speaking person or nation may be referred to as Fra ... [...More Info...] [...Related Items...] OR: [Wikipedia] [Google] [Baidu] |
Latitude
In geography, latitude is a geographic coordinate system, geographic coordinate that specifies the north-south position of a point on the surface of the Earth or another celestial body. Latitude is given as an angle that ranges from −90° at the south pole to 90° at the north pole, with 0° at the Equator. Parallel (latitude), Lines of constant latitude, or ''parallels'', run east-west as circles parallel to the equator. Latitude and longitude are used together as a coordinate pair to specify a location on the surface of the Earth. On its own, the term "latitude" normally refers to the ''geodetic latitude'' as defined below. Briefly, the geodetic latitude of a point is the angle formed between the vector perpendicular (or ''Normal (geometry), normal'') to the ellipsoidal surface from the point, and the equatorial plane, plane of the equator. Background Two levels of abstraction are employed in the definitions of latitude and longitude. In the first step the physical surface i ... [...More Info...] [...Related Items...] OR: [Wikipedia] [Google] [Baidu] |
Longitude
Longitude (, ) is a geographic coordinate that specifies the east- west position of a point on the surface of the Earth, or another celestial body. It is an angular measurement, usually expressed in degrees and denoted by the Greek letter lambda (λ). Meridians are imaginary semicircular lines running from pole to pole that connect points with the same longitude. The prime meridian defines 0° longitude; by convention the International Reference Meridian for the Earth passes near the Royal Observatory in Greenwich, south-east London on the island of Great Britain. Positive longitudes are east of the prime meridian, and negative ones are west. Because of the Earth's rotation, there is a close connection between longitude and time measurement. Scientifically precise local time varies with longitude: a difference of 15° longitude corresponds to a one-hour difference in local time, due to the differing position in relation to the Sun. Comparing local time to an absol ... [...More Info...] [...Related Items...] OR: [Wikipedia] [Google] [Baidu] |
Figure Of The Earth
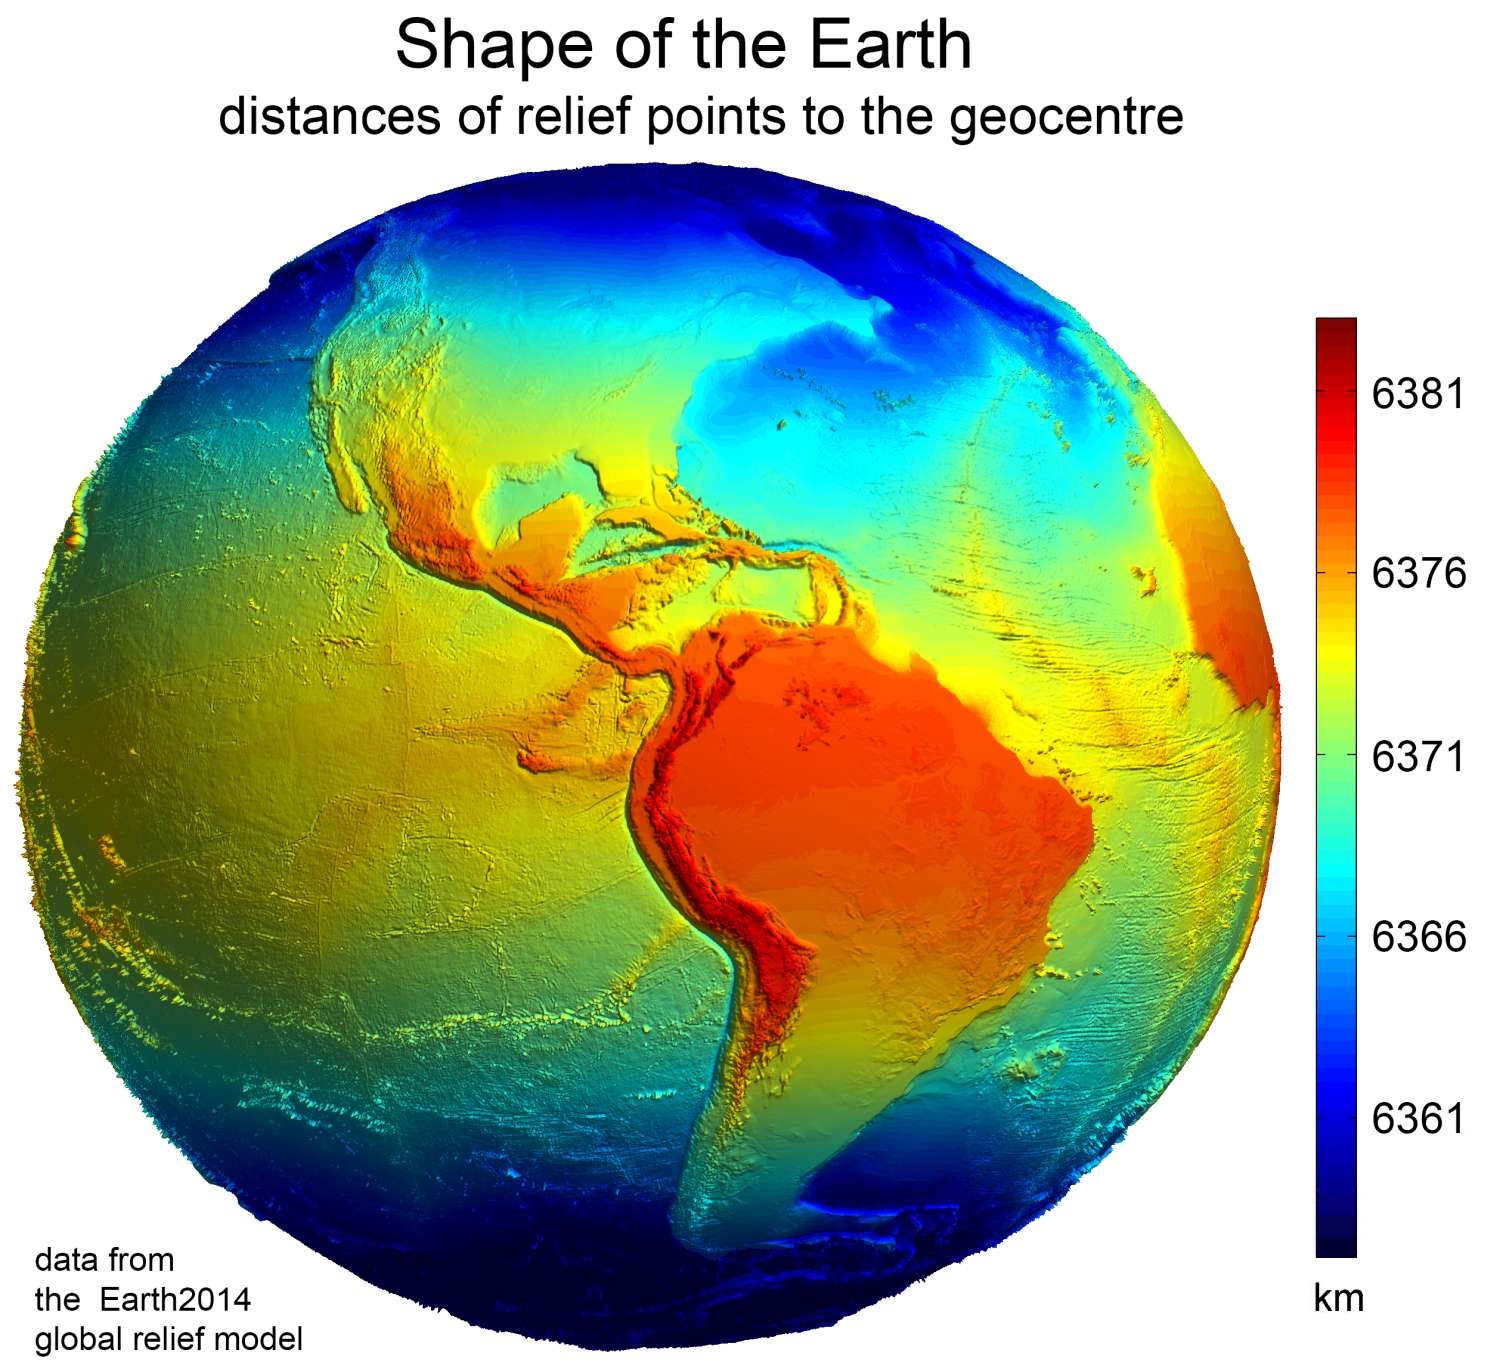
In geodesy, the figure of the Earth is the size and shape used to model planet Earth. The kind of figure depends on application, including the precision needed for the model. A spherical Earth is a well-known historical approximation that is satisfactory for geography, astronomy and many other purposes. Several models with greater accuracy (including ellipsoid) have been developed so that coordinate systems can serve the precise needs of navigation, surveying, cadastre, land use, and various other concerns. Motivation Earth's topographic surface is apparent with its variety of land forms and water areas. This topographic surface is generally the concern of topographers, hydrographers, and geophysicists. While it is the surface on which Earth measurements are made, mathematically modeling it while taking the irregularities into account would be extremely complicated. The Pythagorean concept of a spherical Earth offers a simple surface that is easy to deal with mathem ... [...More Info...] [...Related Items...] OR: [Wikipedia] [Google] [Baidu] |
Pixel
In digital imaging, a pixel (abbreviated px), pel, or picture element is the smallest addressable element in a Raster graphics, raster image, or the smallest addressable element in a dot matrix display device. In most digital display devices, pixels are the smallest element that can be manipulated through software. Each pixel is a Sampling (signal processing), sample of an original image; more samples typically provide more accurate representations of the original. The Intensity (physics), intensity of each pixel is variable. In color imaging systems, a color is typically represented by three or four component intensities such as RGB color model, red, green, and blue, or CMYK color model, cyan, magenta, yellow, and black. In some contexts (such as descriptions of camera sensors), ''pixel'' refers to a single scalar element of a multi-component representation (called a ''photosite'' in the camera sensor context, although ''wikt:sensel, sensel'' is sometimes used), while in yet ... [...More Info...] [...Related Items...] OR: [Wikipedia] [Google] [Baidu] |


