|
Infographics
Infographics (a clipped compound of "information" and "graphics") are graphic visual representations of information, data, or knowledge intended to present information quickly and clearly.Doug Newsom and Jim Haynes (2004). ''Public Relations Writing: Form and Style''. p.236. They can improve cognition by using graphics to enhance the human visual system's ability to see patterns and trends.Card, S. (2009). Information visualization. In A. Sears & J. A. Jacko (Eds.), Human-Computer Interaction: Design Issues, Solutions, and Applications (pp. 510–543). Boca Raton, FL: CRC Press. Similar pursuits are information visualization, data visualization, statistical graphics, information design, or information architecture. Infographics have evolved in recent years to be for mass communication, and thus are designed with fewer assumptions about the readers' knowledge base than other types of visualizations. Isotype (picture language), Isotypes are an early example of infographics conveyi ... [...More Info...] [...Related Items...] OR: [Wikipedia] [Google] [Baidu] |
Information Visualization
Data and information visualization (data viz/vis or info viz/vis) is the practice of designing and creating Graphics, graphic or visual Representation (arts), representations of a large amount of complex quantitative and qualitative data and information with the help of static, dynamic or interactive visual items. Typically based on data and information collected from a certain domain of expertise, these visualizations are intended for a broader audience to help them visually explore and discover, quickly understand, interpret and gain important insights into otherwise difficult-to-identify structures, relationships, correlations, local and global patterns, trends, variations, constancy, clusters, outliers and unusual groupings within data (''exploratory visualization''). When intended for the general public (mass communication) to convey a concise version of known, specific information in a clear and engaging manner (''presentational'' or ''explanatory visualization''), it is t ... [...More Info...] [...Related Items...] OR: [Wikipedia] [Google] [Baidu] |
Information Design
Information design is the practice of presenting information in a way that fosters an efficient and effective understanding of the information. The term has come to be used for a specific area of graphic design related to displaying information effectively, rather than just attractively or for artistic expression. Information design is closely related to the field of data visualization and is often taught as part of graphic design courses. The broad applications of information design along with its close connections to other fields of design and communication practices have created some overlap in the definitions of communication design, data visualization, and information architecture. According to Per Mollerup, information design is explanation design. It explains facts of the universe and leads to knowledge and informed action. History The term 'information design' emerged as a multidisciplinary area of study in the 1970s. Use of the term is said to have started with g ... [...More Info...] [...Related Items...] OR: [Wikipedia] [Google] [Baidu] |
Isotype (picture Language)
Isotype (International System of Typographic Picture Education) is a method of showing social, technological, biological, and historical connections in pictorial form. It consists of a set of standardized and abstracted pictorial symbols to represent social-scientific data with specific guidelines on how to combine the identical figures using serial repetition. It was first known as the Vienna Method of Pictorial Statistics (''Wiener Methode der Bildstatistik''), due to its having been developed at the Gesellschafts- und Wirtschaftsmuseum in Wien (Social and Economic Museum of Vienna) between 1925 and 1934. The founding director of this museum, Otto Neurath, was the initiator and chief theorist of the Vienna Method. Gerd Arntz was the artist responsible for realising the graphics. The term Isotype was applied to the method around 1935, after its key practitioners were forced to leave Vienna by the rise of Austrian fascism. Origin and development The Gesellschafts- und Wirtschaf ... [...More Info...] [...Related Items...] OR: [Wikipedia] [Google] [Baidu] |
Tube Map
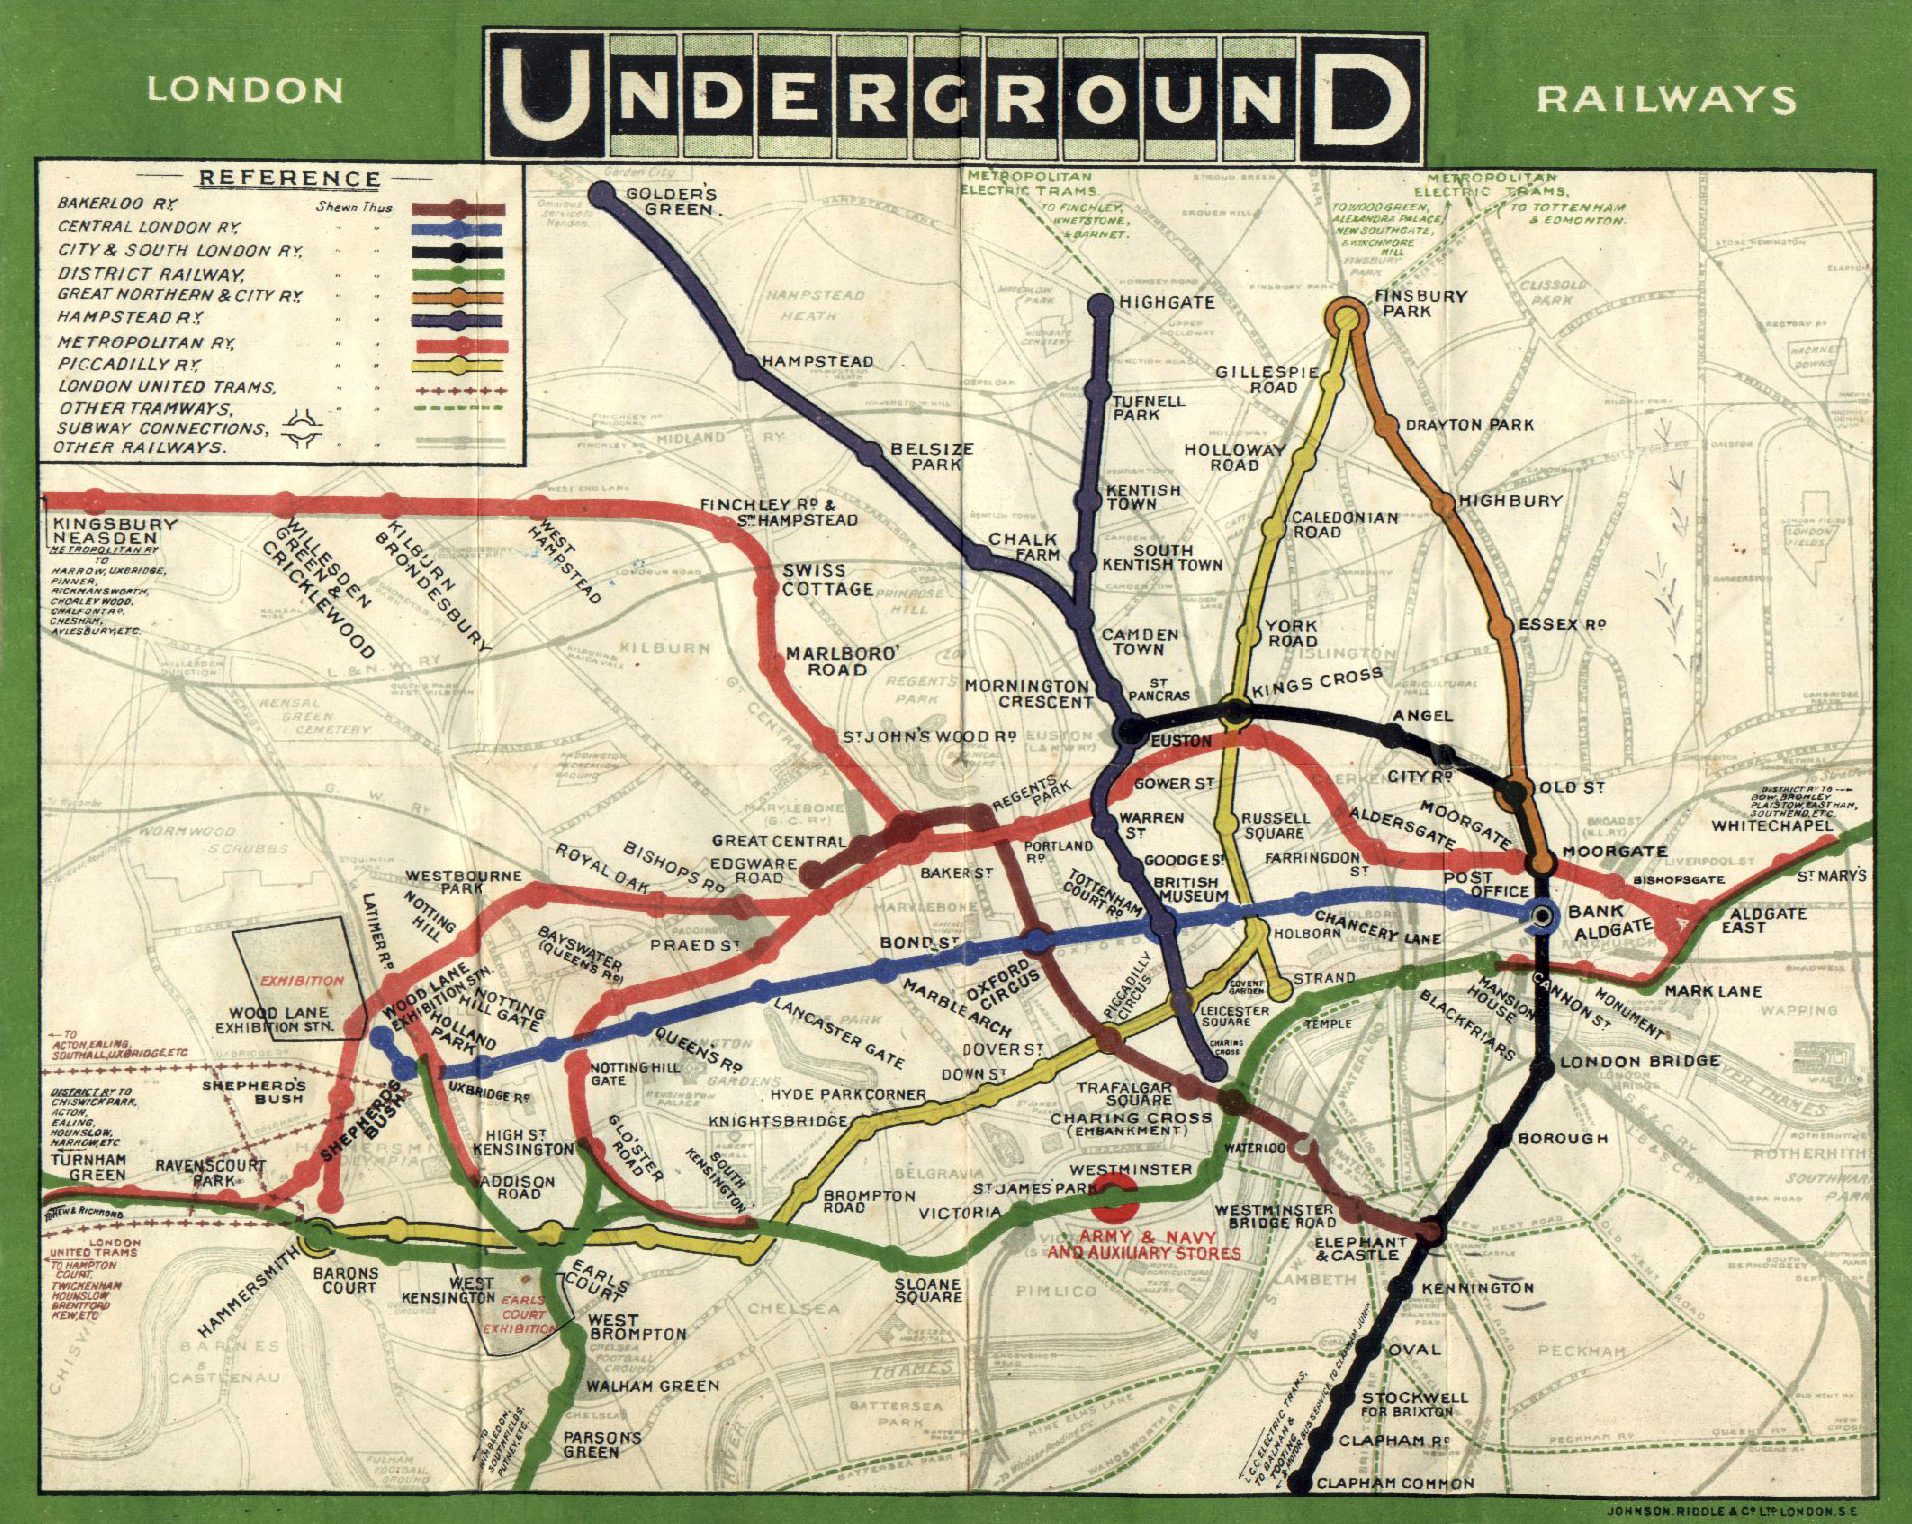
The Tube map (sometimes called the London Underground map) is a schematic transport map of the lines, stations and services of the London Underground, known colloquially as "the Tube", hence the map's name. The first schematic Tube map was designed by Harry Beck in 1931.1933 map from Since then, it has been expanded to include more of London's public transport systems, including the , , the |
Statistical Graphics
Statistical graphics, also known as statistical graphical techniques, are graphics used in the field of statistics for data visualization. Overview Whereas statistics and data analysis procedures generally yield their output in numeric or tabular form, graphical techniques allow such results to be displayed in some sort of pictorial form. They include plots such as scatter plots, histograms, probability plots, spaghetti plots, residual plots, box plots, block plots and biplots. Exploratory data analysis (EDA) relies heavily on such techniques. They can also provide insight into a data set to help with testing assumptions, model selection and regression model validation, estimator selection, relationship identification, factor effect determination, and outlier detection. In addition, the choice of appropriate statistical graphics can provide a convincing means of communicating the underlying message that is present in the data to others. Graphical statistical methods have ... [...More Info...] [...Related Items...] OR: [Wikipedia] [Google] [Baidu] |
The Way Things Work
''The Way Things Work'' is a 1988 nonfiction book by David Macaulay with technical text by Neil Ardley. It is a whimsical introduction to everyday machines and the scientific principles behind their operation, describing machines as simple as levers and gears and as complicated as radio telescopes and automatic transmissions. Every page consists primarily of one or more large diagrams describing the operation of the relevant machine. These diagrams are informative but playful, in that most show the machines operated, used upon, or represented by woolly mammoths, and are accompanied by anecdotes from a mysterious inventor of the mammoths' (fictive) role in the operation. The book's concept was later developed into two short-lived animated TV shows (the former produced by Millimages and distributed by Schlessinger Media, and the latter produced by Children's Television Workshop and Film Roman), a Dorling Kindersley interactive CD-ROM (including a spin-off pinball game, ... [...More Info...] [...Related Items...] OR: [Wikipedia] [Google] [Baidu] |
Bar Chart
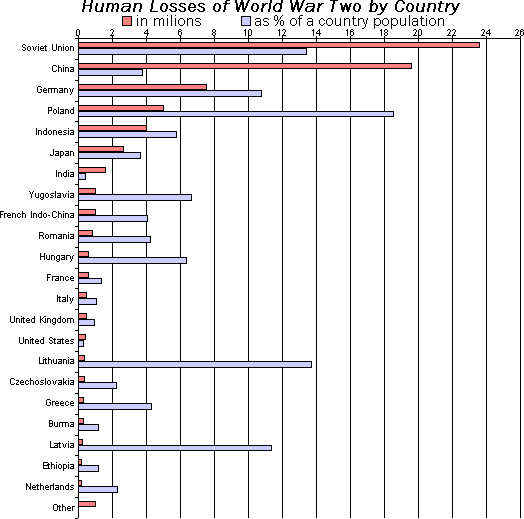
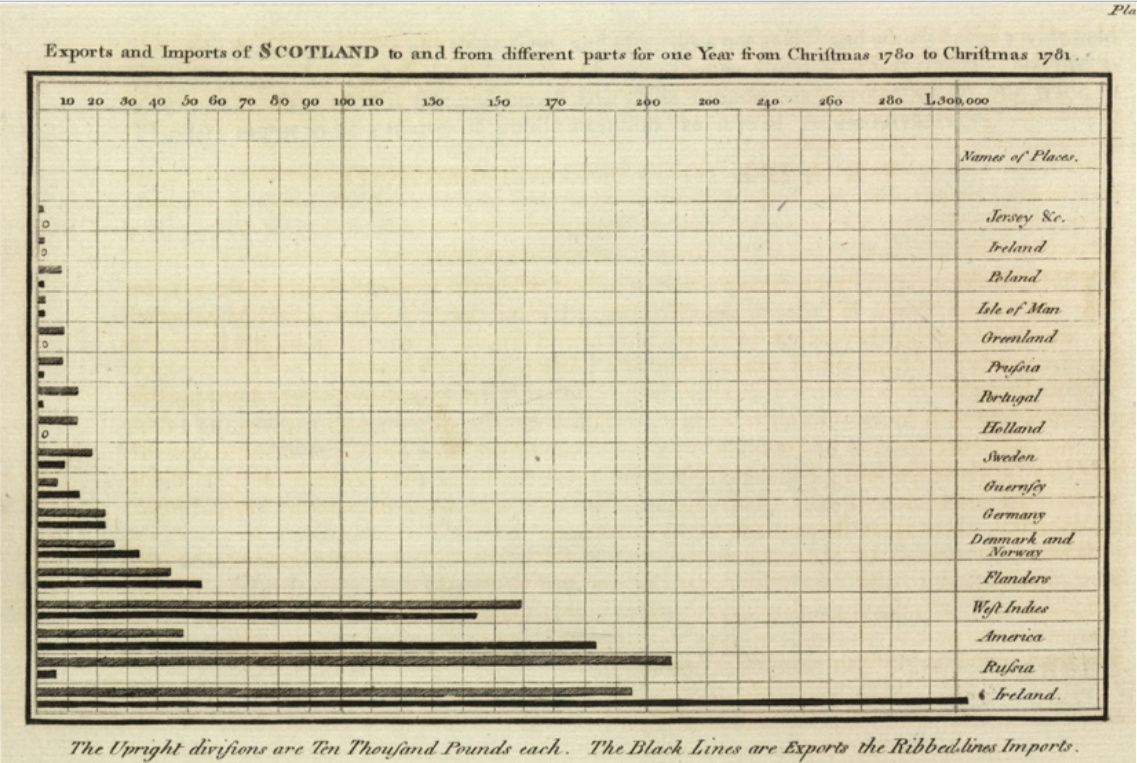
A bar chart or bar graph is a chart or graph that presents categorical variable, categorical data with rectangular bars with heights or lengths proportional to the values that they represent. The bars can be plotted vertically or horizontally. A vertical bar chart is sometimes called a column chart and has been identified as the prototype of charts. A bar graph shows comparisons among discrete variable, discrete categorical variable, categories. One axis of the chart shows the specific categories being compared, and the other axis represents a measured value. Some bar graphs present bars clustered or stacked in groups of more than one, showing the values of more than one measured variable. History Many sources consider William Playfair (1759-1824) to have invented the bar chart and the ''Exports and Imports of Scotland to and from different parts for one Year from Christmas 1780 to Christmas 1781'' graph from his ''The Commercial and Political Atlas'' to be the first bar chart ... [...More Info...] [...Related Items...] OR: [Wikipedia] [Google] [Baidu] |
Line Graph
In the mathematics, mathematical discipline of graph theory, the line graph of an undirected graph is another graph that represents the adjacencies between edge (graph theory), edges of . is constructed in the following way: for each edge in , make a vertex in ; for every two edges in that have a vertex in common, make an edge between their corresponding vertices in . The name ''line graph'' comes from a paper by although both and used the construction before this. Other terms used for the line graph include the covering graph, the derivative, the edge-to-vertex dual, the conjugate, the representative graph, and the θ-obrazom, as well as the edge graph, the interchange graph, the adjoint graph, and the derived graph., p. 71. proved that with one exceptional case the structure of a connected graph can be recovered completely from its line graph. Many other properties of line graphs follow by translating the properties of the underlying graph from vertices into edges ... [...More Info...] [...Related Items...] OR: [Wikipedia] [Google] [Baidu] |
Area Chart
An area chart or area graph displays graphically quantitative data. It is based on the line chart. The area between axis and line are commonly emphasized with colors, textures and hatchings. Commonly one compares two or more quantities with an area chart. History William Playfair is usually credited with inventing the area charts as well as the line, bar, and pie charts. His book ''The Commercial and Political Atlas'', published in 1786, contained a number of time-series graphs, including ''Interest of the National Debt from the Revolution'' and ''Chart of all the Imports and Exports to and from England from the Year 1700 to 1782'' that are often described as the first area charts in history. Common uses Area charts are used to represent cumulated totals using numbers or percentages (stacked area charts in this case) over time. Use the area chart for showing trends over time among related attributes. The area chart is like the plot chart except that the area below the ... [...More Info...] [...Related Items...] OR: [Wikipedia] [Google] [Baidu] |
England
England is a Countries of the United Kingdom, country that is part of the United Kingdom. It is located on the island of Great Britain, of which it covers about 62%, and List of islands of England, more than 100 smaller adjacent islands. It shares Anglo-Scottish border, a land border with Scotland to the north and England–Wales border, another land border with Wales to the west, and is otherwise surrounded by the North Sea to the east, the English Channel to the south, the Celtic Sea to the south-west, and the Irish Sea to the west. Continental Europe lies to the south-east, and Ireland to the west. At the 2021 United Kingdom census, 2021 census, the population was 56,490,048. London is both List of urban areas in the United Kingdom, the largest city and the Capital city, capital. The area now called England was first inhabited by modern humans during the Upper Paleolithic. It takes its name from the Angles (tribe), Angles, a Germanic peoples, Germanic tribe who settled du ... [...More Info...] [...Related Items...] OR: [Wikipedia] [Google] [Baidu] |
William Playfair
William Playfair (22 September 1759 – 11 February 1823) was a Scottish engineer and political economist. The founder of graphical methods of statistics, Playfair invented several types of diagrams: in 1786 he introduced the line, area and bar chart of economic data, and in 1801 he published what were likely the first pie chart and circle graph, used to show part-whole relations. Playfair has been reported to have been a secret agent for the British Government, although this is a subject of controversy. Biography William Playfair was born in 1759 in Scotland. He was the fourth son (named after his grandfather) of the Reverend James Playfair of the parish of Liff & Benvie near the city of Dundee in Scotland; his notable brothers were architect James Playfair and mathematician John Playfair. His father died in 1772 when he was 13, leaving the eldest brother John to care for the family and his education. After his apprenticeship with Andrew Meikle, the inventor of the thre ... [...More Info...] [...Related Items...] OR: [Wikipedia] [Google] [Baidu] |


