|
Cluster-weighted Modeling
In data mining, cluster-weighted modeling (CWM) is an algorithm-based approach to non-linear prediction of outputs ( dependent variables) from inputs (independent variables) based on density estimation using a set of models (clusters) that are each notionally appropriate in a sub-region of the input space. The overall approach works in jointly input-output space and an initial version was proposed by Neil Gershenfeld. Basic form of model The procedure for cluster-weighted modeling of an input-output problem can be outlined as follows. In order to construct predicted values for an output variable ''y'' from an input variable ''x'', the modeling and calibration procedure arrives at a joint probability density function, ''p''(''y'',''x''). Here the "variables" might be uni-variate, multivariate or time-series. For convenience, any model parameters are not indicated in the notation here and several different treatments of these are possible, including setting them to fixed values as a ... [...More Info...] [...Related Items...] OR: [Wikipedia] [Google] [Baidu] |
Data Mining
Data mining is the process of extracting and finding patterns in massive data sets involving methods at the intersection of machine learning, statistics, and database systems. Data mining is an interdisciplinary subfield of computer science and statistics with an overall goal of extracting information (with intelligent methods) from a data set and transforming the information into a comprehensible structure for further use. Data mining is the analysis step of the " knowledge discovery in databases" process, or KDD. Aside from the raw analysis step, it also involves database and data management aspects, data pre-processing, model and inference considerations, interestingness metrics, complexity considerations, post-processing of discovered structures, visualization, and online updating. The term "data mining" is a misnomer because the goal is the extraction of patterns and knowledge from large amounts of data, not the extraction (''mining'') of data itself. It also is a buzzwo ... [...More Info...] [...Related Items...] OR: [Wikipedia] [Google] [Baidu] |
Mixture Model
In statistics, a mixture model is a probabilistic model for representing the presence of subpopulations within an overall population, without requiring that an observed data set should identify the sub-population to which an individual observation belongs. Formally a mixture model corresponds to the mixture distribution that represents the probability distribution of observations in the overall population. However, while problems associated with "mixture distributions" relate to deriving the properties of the overall population from those of the sub-populations, "mixture models" are used to make statistical inferences about the properties of the sub-populations given only observations on the pooled population, without sub-population identity information. Mixture models are used for clustering, under the name model-based clustering, and also for density estimation. Mixture models should not be confused with models for compositional data, i.e., data whose components are constra ... [...More Info...] [...Related Items...] OR: [Wikipedia] [Google] [Baidu] |
Multivariate Statistics
Multivariate statistics is a subdivision of statistics encompassing the simultaneous observation and analysis of more than one outcome variable, i.e., '' multivariate random variables''. Multivariate statistics concerns understanding the different aims and background of each of the different forms of multivariate analysis, and how they relate to each other. The practical application of multivariate statistics to a particular problem may involve several types of univariate and multivariate analyses in order to understand the relationships between variables and their relevance to the problem being studied. In addition, multivariate statistics is concerned with multivariate probability distributions, in terms of both :*how these can be used to represent the distributions of observed data; :*how they can be used as part of statistical inference, particularly where several different quantities are of interest to the same analysis. Certain types of problems involving multivariate da ... [...More Info...] [...Related Items...] OR: [Wikipedia] [Google] [Baidu] |
Normal Distribution
In probability theory and statistics, a normal distribution or Gaussian distribution is a type of continuous probability distribution for a real-valued random variable. The general form of its probability density function is f(x) = \frac e^\,. The parameter is the mean or expectation of the distribution (and also its median and mode), while the parameter \sigma^2 is the variance. The standard deviation of the distribution is (sigma). A random variable with a Gaussian distribution is said to be normally distributed, and is called a normal deviate. Normal distributions are important in statistics and are often used in the natural and social sciences to represent real-valued random variables whose distributions are not known. Their importance is partly due to the central limit theorem. It states that, under some conditions, the average of many samples (observations) of a random variable with finite mean and variance is itself a random variable—whose distribution c ... [...More Info...] [...Related Items...] OR: [Wikipedia] [Google] [Baidu] |
Data Transformation
In computing, data transformation is the process of converting data from one format or structure into another format or structure. It is a fundamental aspect of most data integrationCIO.com. Agile Comes to Data Integration. Retrieved from: https://www.cio.com/article/2378615/data-management/agile-comes-to-data-integration.html and data management tasks such as data wrangling, data warehousing, data integration and application integration. Data transformation can be simple or complex based on the required changes to the data between the source (initial) data and the target (final) data. Data transformation is typically performed via a mixture of manual and automated steps.DataXFormer. Morcos, Abedjan, Ilyas, Ouzzani, Papotti, Stonebraker. An interactive data transformation tool. Retrieved from: http://livinglab.mit.edu/wp-content/uploads/2015/12/DataXFormer-An-Interactive-Data-Transformation-Tool.pdf Tools and technologies used for data transformation can vary widely based on t ... [...More Info...] [...Related Items...] OR: [Wikipedia] [Google] [Baidu] |
Gaussian Function
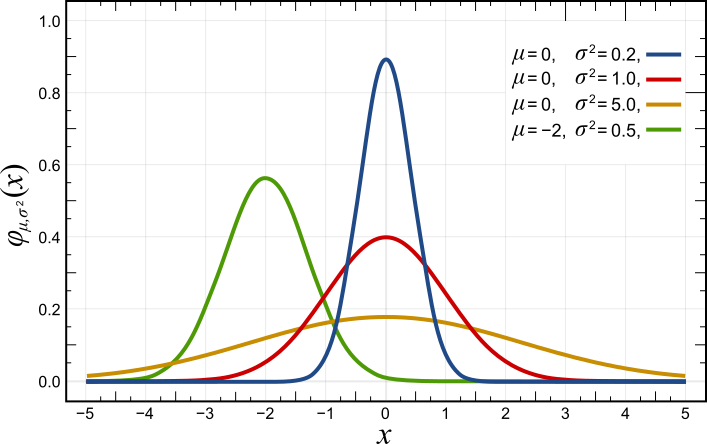
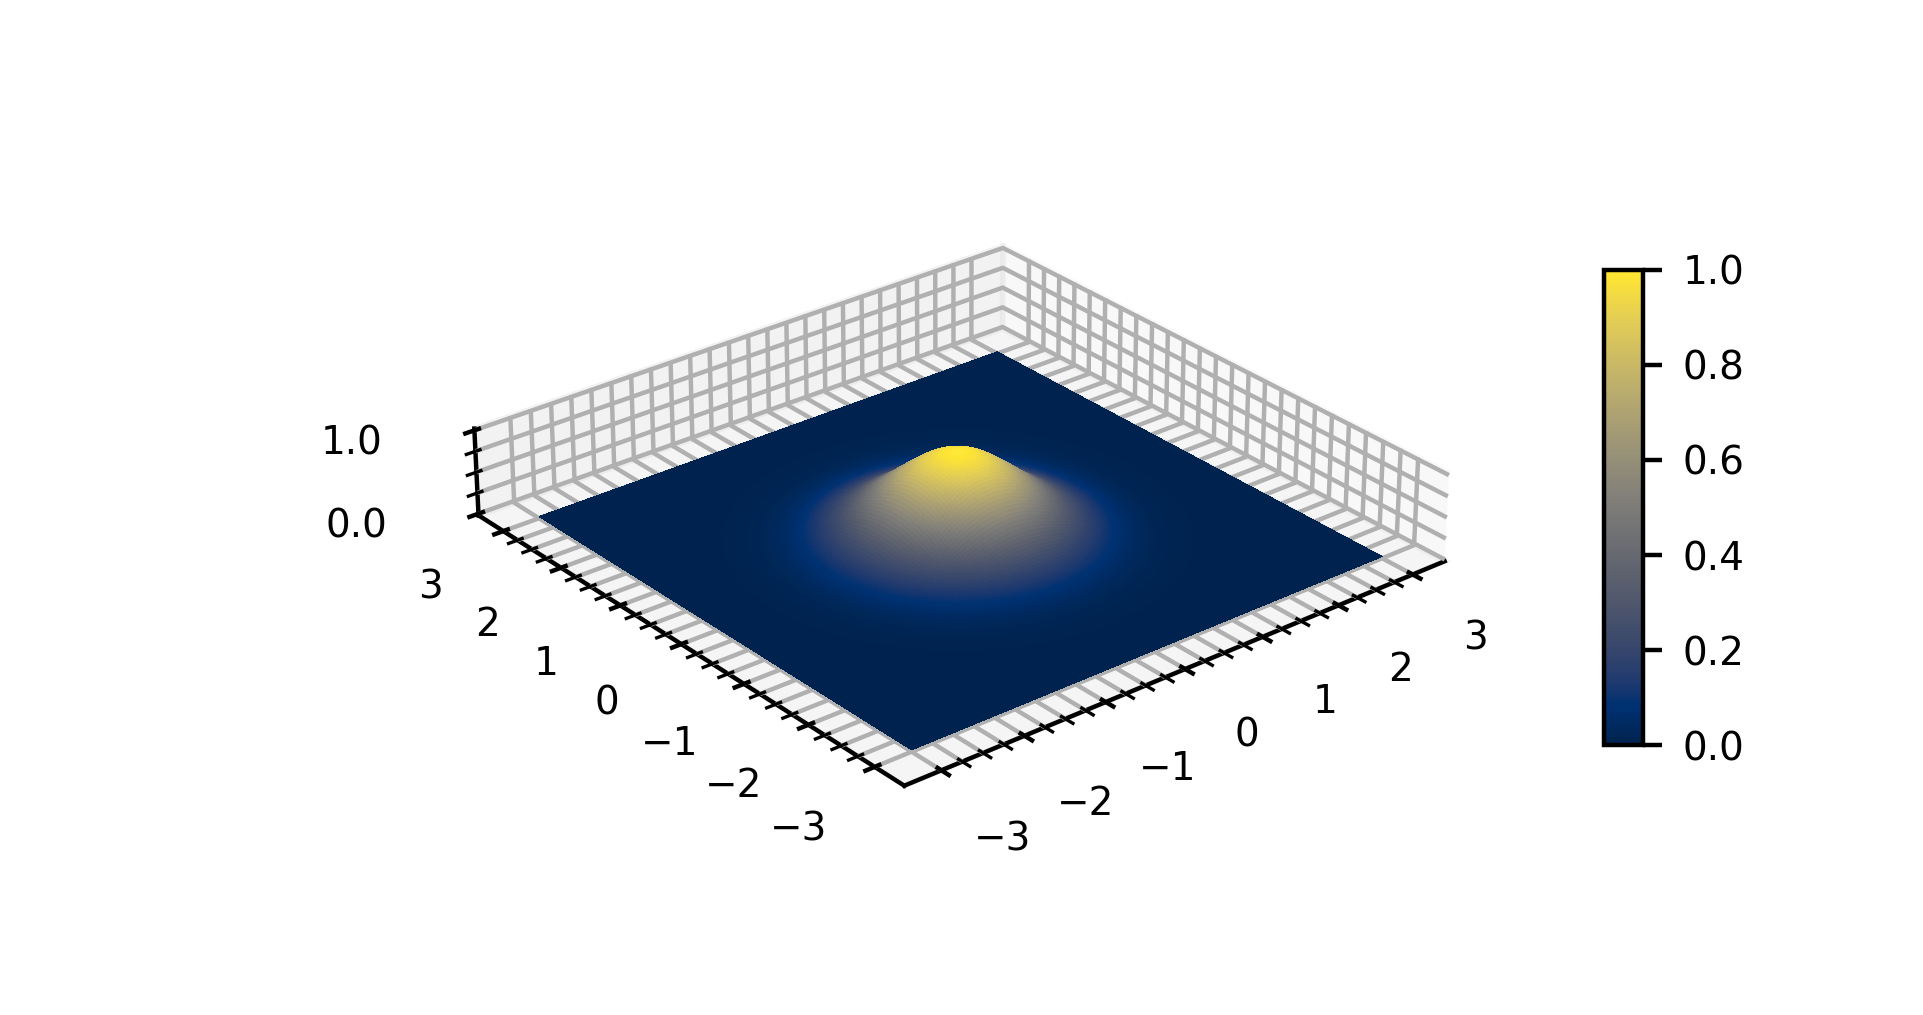
In mathematics, a Gaussian function, often simply referred to as a Gaussian, is a function (mathematics), function of the base form f(x) = \exp (-x^2) and with parametric extension f(x) = a \exp\left( -\frac \right) for arbitrary real number, real constants , and non-zero . It is named after the mathematician Carl Friedrich Gauss. The graph of a function, graph of a Gaussian is a characteristic symmetric "Normal distribution, bell curve" shape. The parameter is the height of the curve's peak, is the position of the center of the peak, and (the standard deviation, sometimes called the Gaussian Root mean square, RMS width) controls the width of the "bell". Gaussian functions are often used to represent the probability density function of a normal distribution, normally distributed random variable with expected value and variance . In this case, the Gaussian is of the form g(x) = \frac \exp\left( -\frac \frac \right). Gaussian functions are widely used in statistics to describ ... [...More Info...] [...Related Items...] OR: [Wikipedia] [Google] [Baidu] |
Marginal Distribution
In probability theory and statistics, the marginal distribution of a subset of a collection of random variables is the probability distribution of the variables contained in the subset. It gives the probabilities of various values of the variables in the subset without reference to the values of the other variables. This contrasts with a conditional distribution, which gives the probabilities contingent upon the values of the other variables. Marginal variables are those variables in the subset of variables being retained. These concepts are "marginal" because they can be found by summing values in a table along rows or columns, and writing the sum in the margins of the table. The distribution of the marginal variables (the marginal distribution) is obtained by marginalizing (that is, focusing on the sums in the margin) over the distribution of the variables being discarded, and the discarded variables are said to have been marginalized out. The context here is that the theoreti ... [...More Info...] [...Related Items...] OR: [Wikipedia] [Google] [Baidu] |
Conditional Variance
In probability theory and statistics, a conditional variance is the variance of a random variable given the value(s) of one or more other variables. Particularly in econometrics, the conditional variance is also known as the scedastic function or skedastic function. Conditional variances are important parts of autoregressive conditional heteroskedasticity (ARCH) models. Definition The conditional variance of a random variable ''Y'' given another random variable ''X'' is :\operatorname(Y\mid X) = \operatorname\Big(\big(Y - \operatorname(Y\mid X)\big)^\;\Big, \; X\Big). The conditional variance tells us how much variance is left if we use \operatorname(Y\mid X) to "predict" ''Y''. Here, as usual, \operatorname(Y\mid X) stands for the conditional expectation of ''Y'' given ''X'', which we may recall, is a random variable itself (a function of ''X'', determined up to probability one). As a result, \operatorname(Y\mid X) itself is a random variable (and is a function of ''X''). Expl ... [...More Info...] [...Related Items...] OR: [Wikipedia] [Google] [Baidu] |
Dependent And Independent Variables
A variable is considered dependent if it depends on (or is hypothesized to depend on) an independent variable. Dependent variables are studied under the supposition or demand that they depend, by some law or rule (e.g., by a mathematical function), on the values of other variables. Independent variables, on the other hand, are not seen as depending on any other variable in the scope of the experiment in question. Rather, they are controlled by the experimenter. In pure mathematics In mathematics, a function (mathematics), function is a rule for taking an input (in the simplest case, a number or set of numbers)Carlson, Robert. A concrete introduction to real analysis. CRC Press, 2006. p.183 and providing an output (which may also be a number). A symbol that stands for an arbitrary input is called an independent variable, while a symbol that stands for an arbitrary output is called a dependent variable. The most common symbol for the input is , and the most common symbol for the o ... [...More Info...] [...Related Items...] OR: [Wikipedia] [Google] [Baidu] |
Conditional Expected Value
In probability theory, the conditional expectation, conditional expected value, or conditional mean of a random variable is its expected value evaluated with respect to the conditional probability distribution. If the random variable can take on only a finite number of values, the "conditions" are that the variable can only take on a subset of those values. More formally, in the case when the random variable is defined over a discrete probability space, the "conditions" are a partition of this probability space. Depending on the context, the conditional expectation can be either a random variable or a function. The random variable is denoted E(X\mid Y) analogously to conditional probability. The function form is either denoted E(X\mid Y=y) or a separate function symbol such as f(y) is introduced with the meaning E(X\mid Y) = f(Y). Examples Example 1: Dice rolling Consider the roll of a fair die and let ''A'' = 1 if the number is even (i.e., 2, 4, or 6) and ''A'' = 0 otherwise ... [...More Info...] [...Related Items...] OR: [Wikipedia] [Google] [Baidu] |
Conditional Probability Distribution
In probability theory and statistics, the conditional probability distribution is a probability distribution that describes the probability of an outcome given the occurrence of a particular event. Given two jointly distributed random variables X and Y, the conditional probability distribution of Y given X is the probability distribution of Y when X is known to be a particular value; in some cases the conditional probabilities may be expressed as functions containing the unspecified value x of X as a parameter. When both X and Y are categorical variables, a conditional probability table is typically used to represent the conditional probability. The conditional distribution contrasts with the marginal distribution of a random variable, which is its distribution without reference to the value of the other variable. If the conditional distribution of Y given X is a continuous distribution, then its probability density function is known as the conditional density function. The prop ... [...More Info...] [...Related Items...] OR: [Wikipedia] [Google] [Baidu] |


