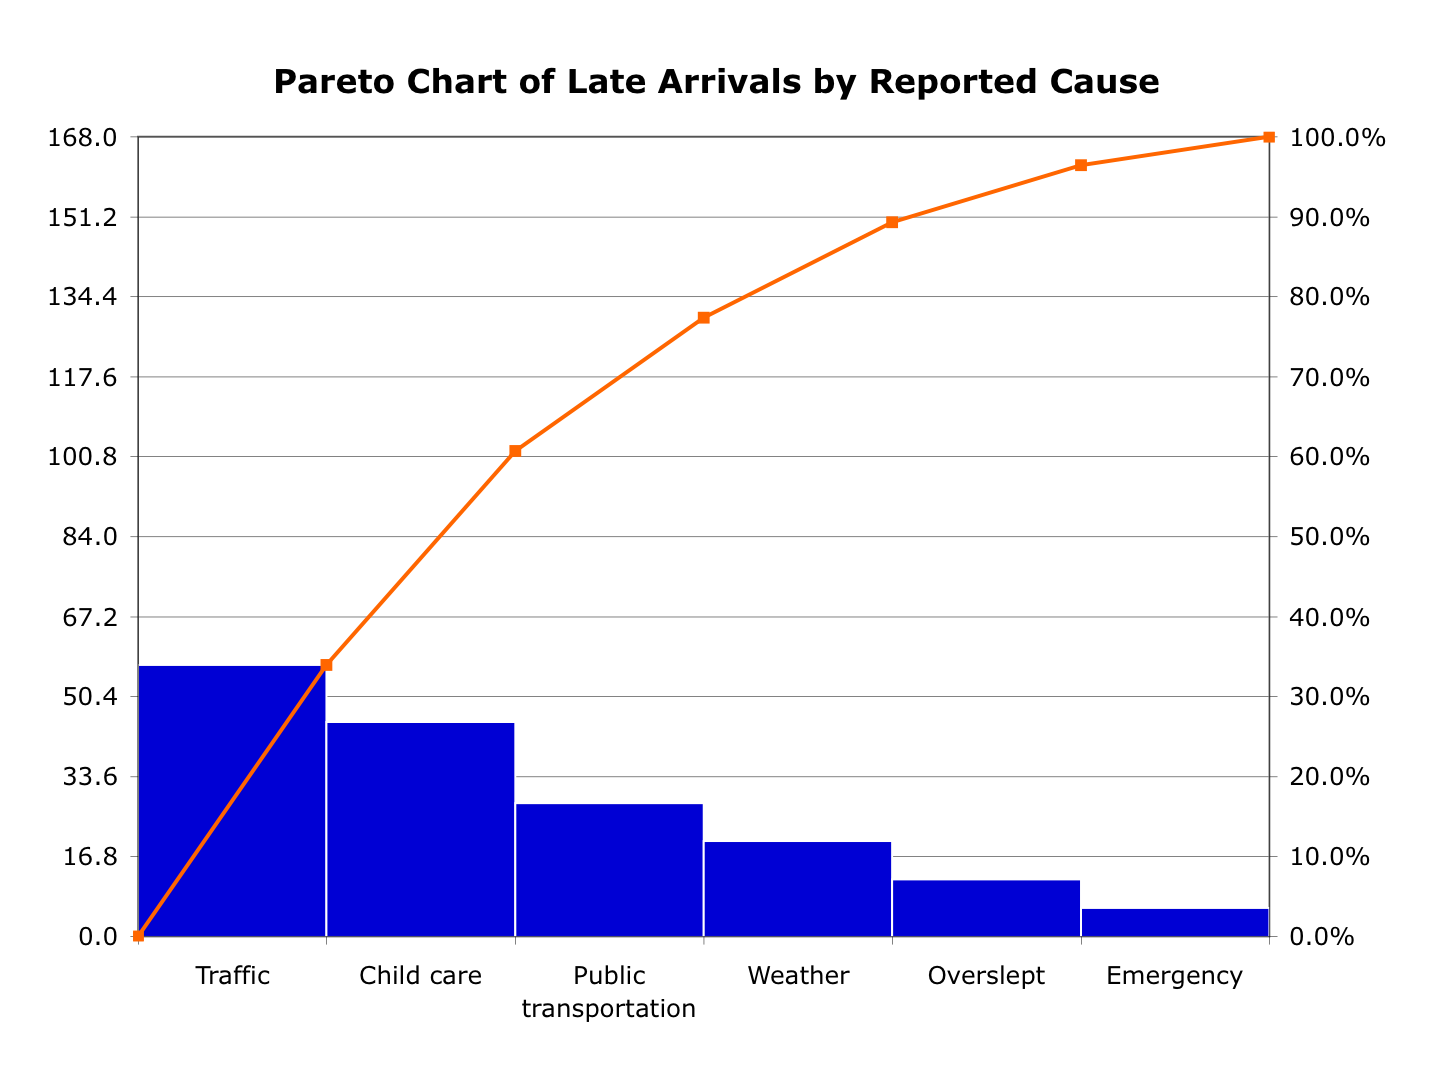
Pareto Chart on:
[Wikipedia]
[Google]
[Amazon]
 A Pareto chart is a type of chart that contains both bars and a
line graph
In the mathematics, mathematical discipline of graph theory, the line graph of an undirected graph is another graph that represents the adjacencies between edge (graph theory), edges of . is constructed in the following way: for each edge i ...
, where individual values are represented in descending order by bars, and the cumulative total is represented by the line. The chart is named for the Pareto principle, which, in turn, derives its name from Vilfredo Pareto
Vilfredo Federico Damaso Pareto (; ; born Wilfried Fritz Pareto; 15 July 1848 – 19 August 1923) was an Italian polymath, whose areas of interest included sociology, civil engineering, economics, political science, and philosophy. He made severa ...
, a noted Italian economist.
Description
The left vertical axis is the frequency of occurrence, but it can alternatively represent cost or another importantunit of measure
A unit of measurement, or unit of measure, is a definite magnitude of a quantity, defined and adopted by convention or by law, that is used as a standard for measurement of the same kind of quantity. Any other quantity of that kind can ...
. The right vertical axis is the cumulative percentage of the total number of occurrences, total cost, or total of the particular unit of measure. Because the values are in decreasing order, the cumulative function is a concave function
In mathematics, a concave function is one for which the function value at any convex combination of elements in the domain is greater than or equal to that convex combination of those domain elements. Equivalently, a concave function is any funct ...
. To take the example below, in order to lower the amount of late arrivals by 78%, it is sufficient to solve the first three issues.
The Pareto Chart demonstrates a power law relationship between the rank of a quality issue and that issue’s contribution to cost. This means one can find a linear relationship on a log-log plot.
The purpose of the Pareto chart is to highlight the most important among a (typically large) set of factors. In quality control
Quality control (QC) is a process by which entities review the quality of all factors involved in production. ISO 9000 defines quality control as "a part of quality management focused on fulfilling quality requirements".
This approach plac ...
, Pareto charts are useful to find the defects to prioritize in order to observe the greatest overall improvement. It often represents the most common sources of defects, the highest occurring type of defect, or the most frequent reasons for customer complaints, and so on. Wilkinson (2006)
devised an algorithm for producing statistically based acceptance limits (similar to confidence intervals) for each bar in the Pareto chart.
These charts can be generated by simple spreadsheet
A spreadsheet is a computer application for computation, organization, analysis and storage of data in tabular form. Spreadsheets were developed as computerized analogs of paper accounting worksheets. The program operates on data entered in c ...
programs, specialized statistical software tools, and online quality charts generators.
The Pareto chart is one of the seven basic tools of quality control.
See also
* Control chart *Histogram
A histogram is a visual representation of the frequency distribution, distribution of quantitative data. To construct a histogram, the first step is to Data binning, "bin" (or "bucket") the range of values— divide the entire range of values in ...
*Cumulative distribution function
In probability theory and statistics, the cumulative distribution function (CDF) of a real-valued random variable X, or just distribution function of X, evaluated at x, is the probability that X will take a value less than or equal to x.
Ever ...
(CDF)
* Pareto analysis
* Pareto principle
* Statistical process control (SPC)
References
Further reading
*Hart, K. M., & Hart, R. F. (1989). ''Quantitative methods for quality improvement''. Milwaukee, WI: ASQC Quality Press. Santosh: Pre Press *Juran, J. M. (1962). ''Quality control handbook''. New York: McGraw-Hill. *Juran, J. M., & Gryna, F. M. (1970). ''Quality planning and analysis''. New York: McGraw-Hill. *Montgomery, D. C. (1985). ''Statistical quality control''. New York: Wiley. *Montgomery, D. C. (1991). ''Design and analysis of experiments'', 3rd ed. New York: Wiley. *Pyzdek, T. (1989). ''What every engineer should know about quality control''. New York: Marcel Dekker. *Vaughn, R. C. (1974). ''Quality control''. Ames, IA: Iowa State Press. {{DEFAULTSORT:Pareto Chart Categorical data Product management Quality Quality control tools Statistical charts and diagrams Vilfredo Pareto