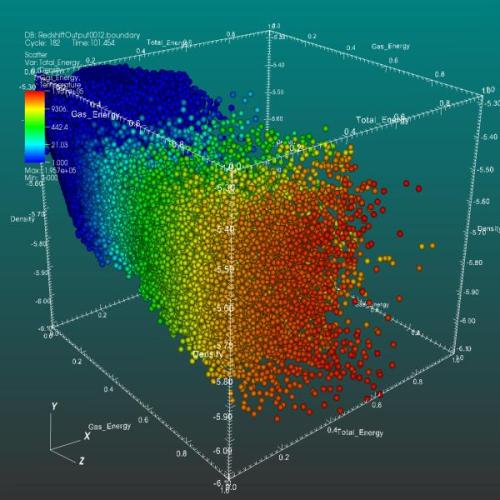
Glyph (data Visualization) on:
[Wikipedia]
[Google]
[Amazon]
 In the context of data visualization, a
Visualize Free - Data Visualization Software & Visual Analytics ApplicationData Science - Learn, Grow, Build Connections & Transform The World With AI
Infographics Data and information visualization Computer graphics {{Compu-graphics-stub
 In the context of data visualization, a
 glyph
A glyph ( ) is any kind of purposeful mark. In typography, a glyph is "the specific shape, design, or representation of a character". It is a particular graphical representation, in a particular typeface, of an element of written language. A ...
is any marker, such as an arrow or similar marking, used to specify part of a visualization. This is a representation to visualize data where the data set is presented as a collection of visual objects. These visual objects are collectively called a glyph. It helps visualizing data relation in data analysis, statistics, etc. by using any custom notation.
Constructing glyphs
Glyph construction can be a complex process when there are many dimensions to be represented in the visualization. Maguire et al proposed a taxonomy based approach to glyph-design that uses a tree to guide the visual encodings used to representation various data items. Duffy et al created perhaps one of the most complex glyph representations with their representation of sperm movement.References
Further reading
*External links
Visualize Free - Data Visualization Software & Visual Analytics Application
Infographics Data and information visualization Computer graphics {{Compu-graphics-stub