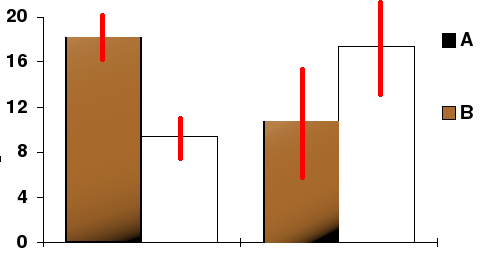
Error bar on:
[Wikipedia]
[Google]
[Amazon]
 Error bars are graphical representations of the variability of data and used on graphs to indicate the
 Error bars are graphical representations of the variability of data and used on graphs to indicate the
 error
An error (from the Latin , meaning 'to wander'Oxford English Dictionary, s.v. “error (n.), Etymology,” September 2023, .) is an inaccurate or incorrect action, thought, or judgement.
In statistics, "error" refers to the difference between t ...
or uncertainty
Uncertainty or incertitude refers to situations involving imperfect or unknown information. It applies to predictions of future events, to physical measurements that are already made, or to the unknown, and is particularly relevant for decision ...
in a reported measurement. They give a general idea of how precise a measurement is, or conversely, how far from the reported value the true (error free) value might be. Error bars often represent one standard deviation
In statistics, the standard deviation is a measure of the amount of variation of the values of a variable about its Expected value, mean. A low standard Deviation (statistics), deviation indicates that the values tend to be close to the mean ( ...
of uncertainty, one standard error
The standard error (SE) of a statistic (usually an estimator of a parameter, like the average or mean) is the standard deviation of its sampling distribution or an estimate of that standard deviation. In other words, it is the standard deviati ...
, or a particular confidence interval (e.g., a 95% interval). These quantities are not the same and so the measure selected should be stated explicitly in the graph or supporting text.
Error bars can be used to compare visually two quantities if various other conditions hold. This can determine whether differences are statistically significant. Error bars can also suggest goodness of fit
The goodness of fit of a statistical model describes how well it fits a set of observations. Measures of goodness of fit typically summarize the discrepancy between observed values and the values expected under the model in question. Such measur ...
of a given function, i.e., how well the function describes the data. Scientific papers in the experimental sciences are expected to include error bars on all graphs, though the practice differs somewhat between sciences, and each journal will have its own house style. It has also been shown that error bars can be used as a direct manipulation interface for controlling probabilistic algorithms for approximate computation. Error bars can also be expressed in a plus–minus sign
The plus–minus sign or plus-or-minus sign () and the complementary minus-or-plus sign () are symbols with broadly similar multiple meanings.
*In mathematics, the sign generally indicates a choice of exactly two possible values, one of which i ...
(±), plus the upper limit of the error and minus the lower limit of the error..
A notorious misconception in elementary statistics is that error bars show whether a statistically significant difference exists, by checking simply for whether the error bars overlap; this is not the case.
See also
*Box plot
In descriptive statistics, a box plot or boxplot is a method for demonstrating graphically the locality, spread and skewness groups of numerical data through their quartiles.
In addition to the box on a box plot, there can be lines (which are ca ...
*Information graphics
Infographics (a clipped compound of " information" and " graphics") are graphic visual representations of information, data, or knowledge intended to present information quickly and clearly.Doug Newsom and Jim Haynes (2004). ''Public Relations ...
*Model selection
Model selection is the task of selecting a model from among various candidates on the basis of performance criterion to choose the best one.
In the context of machine learning and more generally statistical analysis, this may be the selection of ...
*Significant figures
Significant figures, also referred to as significant digits, are specific digits within a number that is written in positional notation that carry both reliability and necessity in conveying a particular quantity. When presenting the outcom ...
References
Statistical charts and diagrams {{statistics-stub