epidemic curve on:
[Wikipedia]
[Google]
[Amazon]
An epidemic curve, also known as an epi curve or epidemiological curve, is a statistical
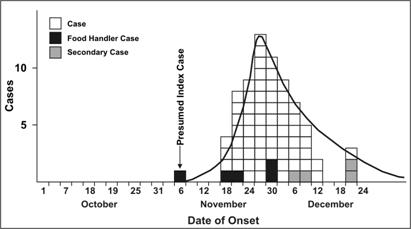
 This epidemic curve shows a presumed first case, known as the index case on November 6, 1978. 4 days later, there was a steep increase in cases, followed by the curve tapering down to zero. Some cases were food handlers, and some secondary cases. It showed that this is probably a common source outbreak. Sometimes, cases could have been exposed days or weeks prior, and diseases with longer incubation periods would flatten these epidemic curves and lower the peaks.
chart
A chart (sometimes known as a graph) is a graphics, graphical representation for data visualization, in which "the data is represented by symbols, such as bars in a bar chart, lines in a line chart, or slices in a pie chart". A chart can repres ...
used in epidemiology
Epidemiology is the study and analysis of the distribution (who, when, and where), patterns and Risk factor (epidemiology), determinants of health and disease conditions in a defined population, and application of this knowledge to prevent dise ...
to visualise the onset of a disease outbreak
In epidemiology, an outbreak is a sudden increase in occurrences of a disease when cases are in excess of normal expectancy for the location or season. It may affect a small and localized group or impact upon thousands of people across an entire ...
. It can help with the identification of the mode of transmission
Transmission or transmit may refer to:
Science and technology
* Power transmission
** Electric power transmission
** Transmission (mechanical device), technology that allows controlled application of power
*** Automatic transmission
*** Manual tra ...
of the disease. It can also show the disease's magnitude, whether cases are clustered or if there are individual case outliers, its trend over time, and its incubation period. It can give outbreak investigators an idea as to whether an outbreak is likely to be from a point source
A point source is a single identifiable ''localized'' source of something. A point source has a negligible extent, distinguishing it from other source geometries. Sources are called point sources because, in mathematical modeling, these sources ...
(such as from a food handler), a continuous common source (with ongoing contamination), or a propagated source (that is transmitted primarily between people).
Epidemic curves generally show the frequency of new cases compared to the date of disease onset.
Examples
Hepatitis A
 This epidemic curve shows a presumed first case, known as the index case on November 6, 1978. 4 days later, there was a steep increase in cases, followed by the curve tapering down to zero. Some cases were food handlers, and some secondary cases. It showed that this is probably a common source outbreak. Sometimes, cases could have been exposed days or weeks prior, and diseases with longer incubation periods would flatten these epidemic curves and lower the peaks.
COVID-19 pandemic
The first description of epidemiological curves from theCOVID-19 pandemic
The COVID-19 pandemic (also known as the coronavirus pandemic and COVID pandemic), caused by severe acute respiratory syndrome coronavirus 2 (SARS-CoV-2), began with an disease outbreak, outbreak of COVID-19 in Wuhan, China, in December ...
showed the pattern of a "mixed outbreak". According to the investigators, there was likely a continuous common source outbreak at Wuhan Seafood Market in December 2019, potentially from several zoonotic
A zoonosis (; plural zoonoses) or zoonotic disease is an infectious disease of humans caused by a pathogen (an infectious agent, such as a virus, bacterium, parasite, fungi, or prion) that can jump from a non-human vertebrate to a human. When h ...
events. As of the date of publication of the study, it is unknown which animal may have been the original reservoir of the virus, or how it was originally transmitted to humans. Following this, the investigators found that the outbreak likely became a propagated source, meaning that the virus became able to be transmitted from person to person. ''The New York Times
''The New York Times'' (''NYT'') is an American daily newspaper based in New York City. ''The New York Times'' covers domestic, national, and international news, and publishes opinion pieces, investigative reports, and reviews. As one of ...
'' has published a curve simulator for both the US and the world, on which the visitor can tinker the base parameters to get various outcomes.
See also
*Infection control
Infection prevention and control (IPC) is the discipline concerned with preventing healthcare-associated infections; a practical rather than academic sub-discipline of epidemiology. In Northern Europe, infection prevention and control is expande ...
* Social distancing
In public health, social distancing, also called physical distancing, (NB. Regula Venske is president of the PEN Centre Germany.) is a set of non-pharmaceutical interventions or measures intended to prevent the spread of a contagious dise ...
* Flatten the curve and raise the line
* Farr's laws
References
{{reflist, 30EM Epidemics Statistical charts and diagrams