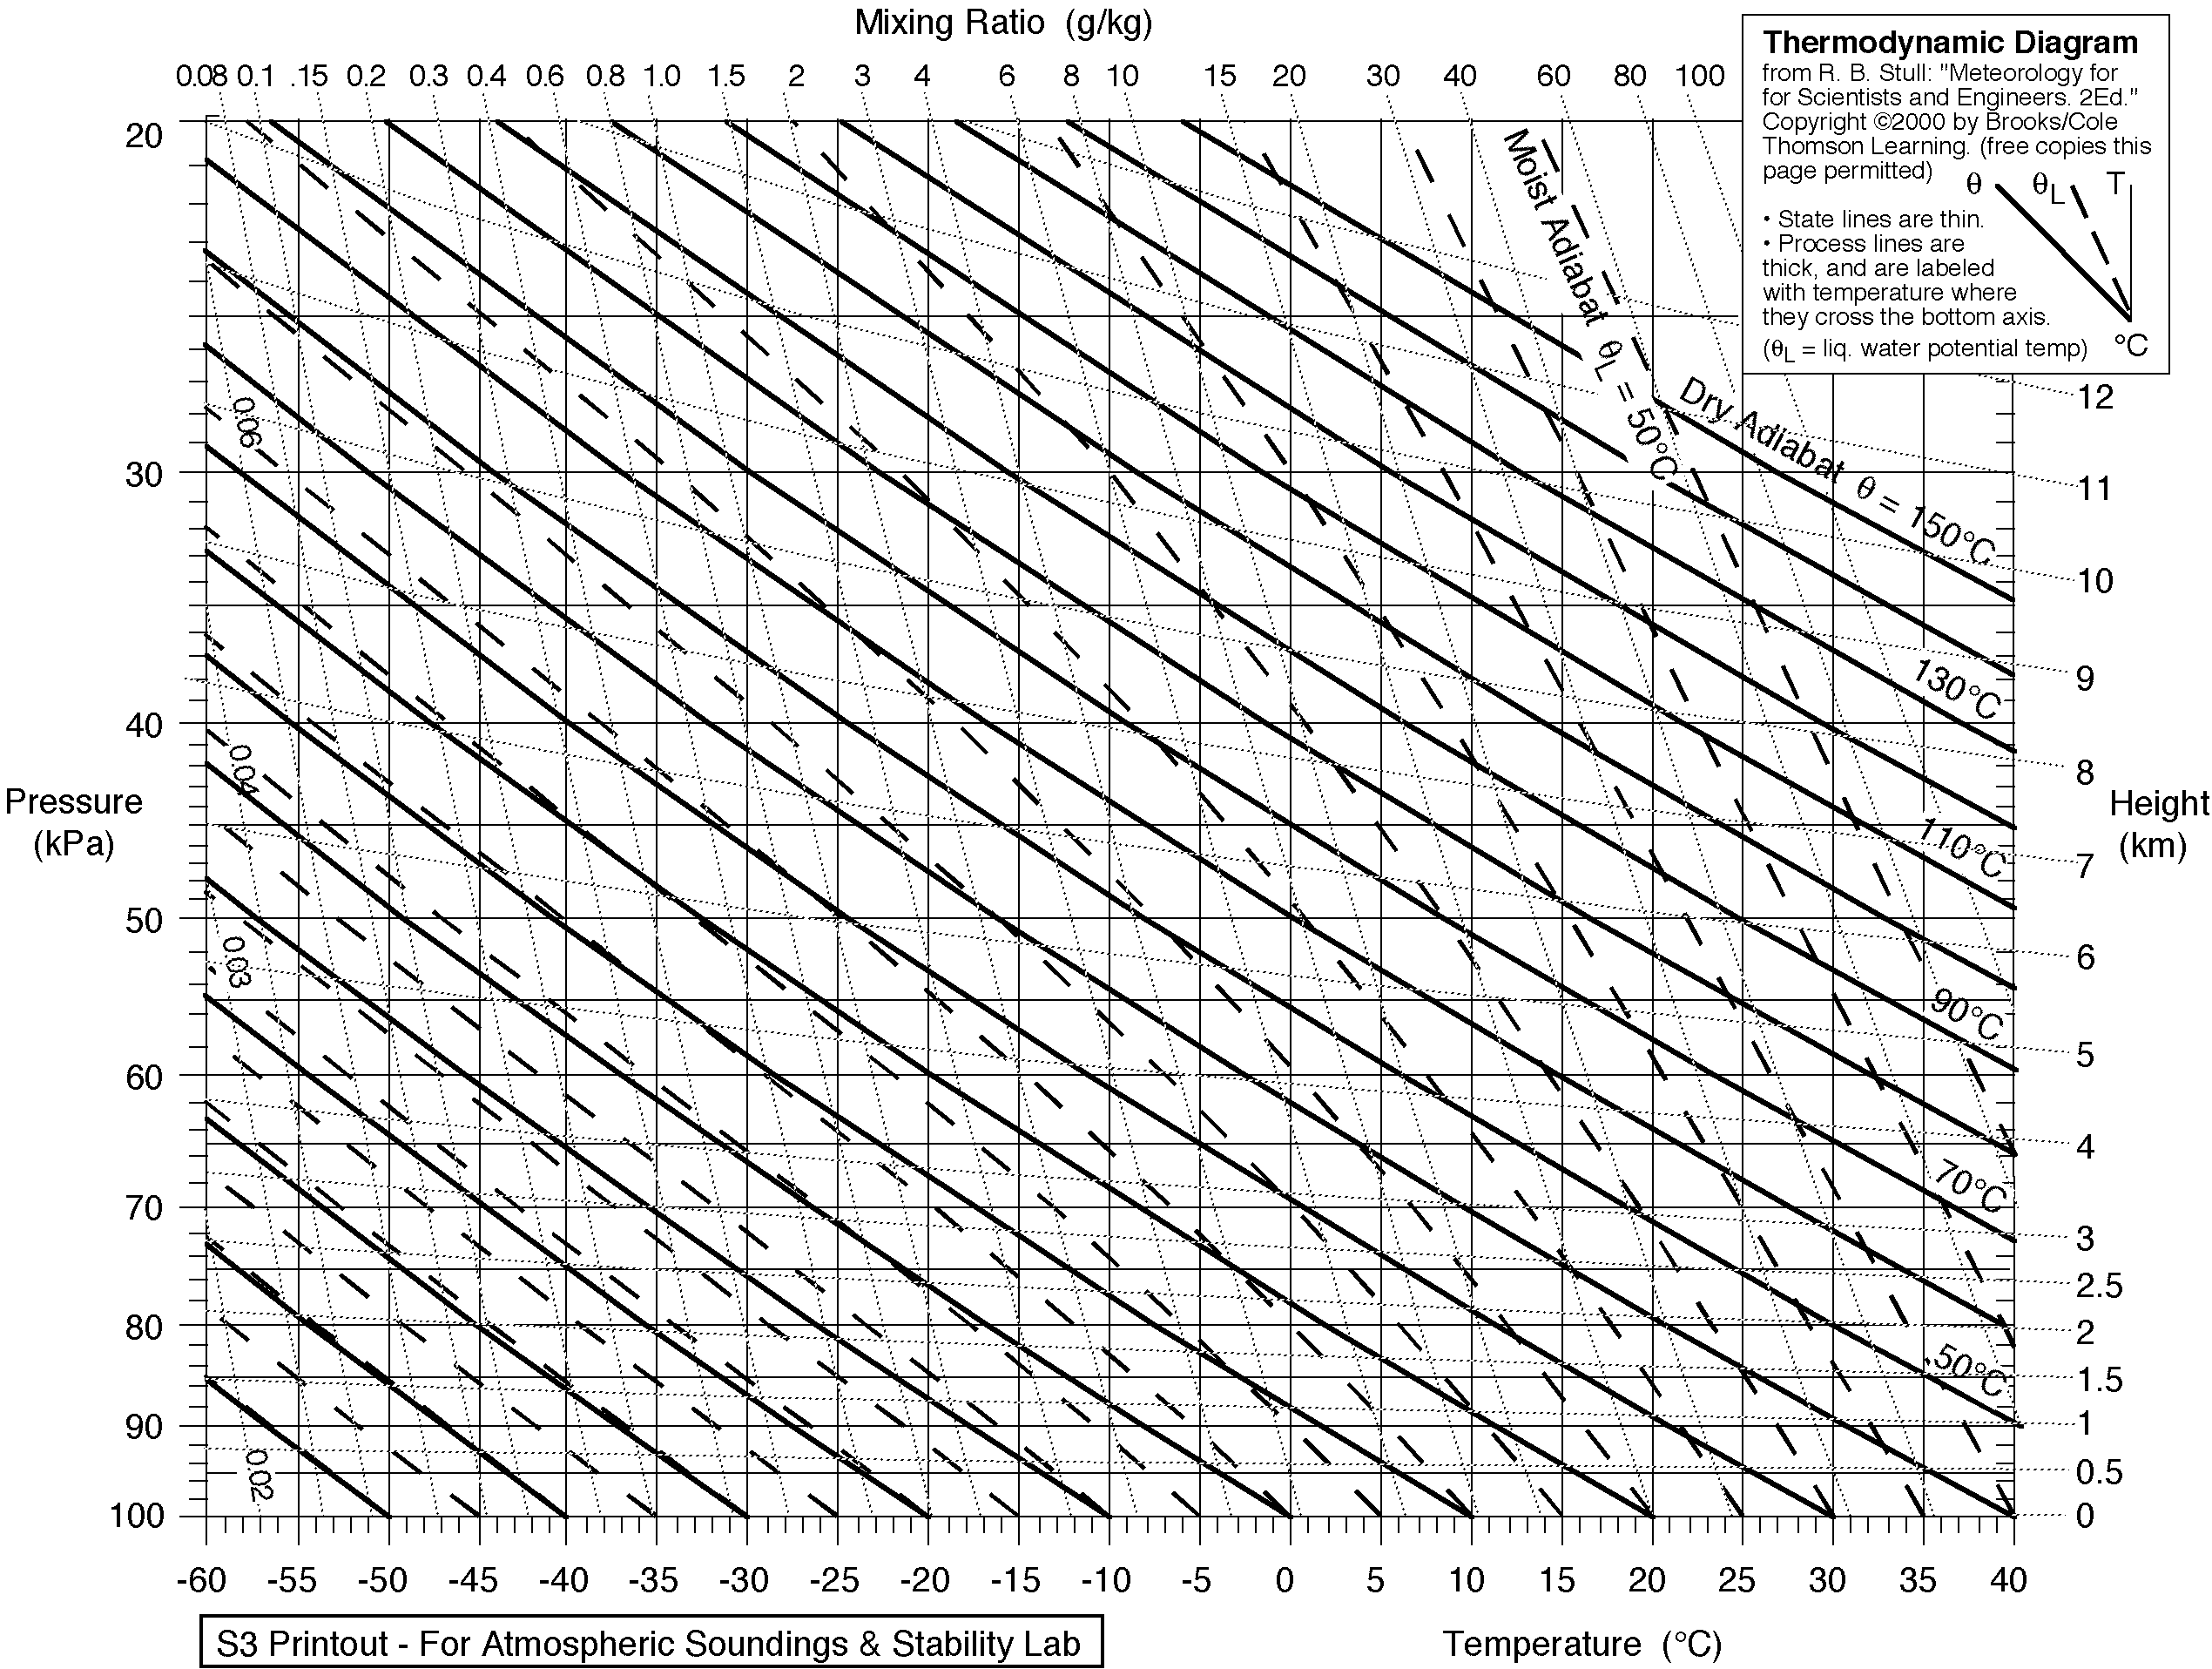
Emagram on:
[Wikipedia]
[Google]
[Amazon]
 An emagram is one of four
Thermodynamic diagrams
thermodynamic diagrams
Thermodynamic diagrams are diagrams used to represent the thermodynamic states of a material (typically fluid) and the consequences of manipulating this material. For instance, a temperature–entropy diagram (Temperature–entropy diagram, T–s ...
used to display temperature lapse rate
The lapse rate is the rate at which an atmospheric variable, normally temperature in Earth's atmosphere, falls with altitude. ''Lapse rate'' arises from the word ''lapse'' (in its "becoming less" sense, not its "interruption" sense). In dry air, ...
and moisture content profiles in the atmosphere. The emagram has axes of temperature
Temperature is a physical quantity that quantitatively expresses the attribute of hotness or coldness. Temperature is measurement, measured with a thermometer. It reflects the average kinetic energy of the vibrating and colliding atoms making ...
(T) and pressure
Pressure (symbol: ''p'' or ''P'') is the force applied perpendicular to the surface of an object per unit area over which that force is distributed. Gauge pressure (also spelled ''gage'' pressure)The preferred spelling varies by country and eve ...
(p). In the emagram, the dry adiabats make an angle of about 45 degrees with the isobars, isotherms are vertical and isopleths
A contour line (also isoline, isopleth, isoquant or isarithm) of a function of two variables is a curve along which the function has a constant value, so that the curve joins points of equal value. It is a plane section of the three-dimensi ...
of saturation mixing ratio are almost straight and vertical.
Usually, temperature
Temperature is a physical quantity that quantitatively expresses the attribute of hotness or coldness. Temperature is measurement, measured with a thermometer. It reflects the average kinetic energy of the vibrating and colliding atoms making ...
and dew point
The dew point is the temperature the air needs to be cooled to (at constant pressure) in order to produce a relative humidity of 100%. This temperature depends on the pressure and water content of the air. When the air at a temperature above the ...
data from radiosonde
A radiosonde is a battery-powered telemetry instrument carried into the atmosphere usually by a weather balloon that measures various atmospheric parameters and transmits them by radio to a ground receiver. Modern radiosondes measure or calculat ...
s are plotted on these diagrams to allow calculations of convective stability or Convective Available Potential Energy (CAPE). Wind barbs are often plotted at the side of a tephigram to indicate the winds at different heights.
First devised in 1884 by Heinrich Hertz
Heinrich Rudolf Hertz (; ; 22 February 1857 – 1 January 1894) was a German physicist who first conclusively proved the existence of the electromagnetic waves predicted by James Clerk Maxwell's equations of electromagnetism.
Biography
Heinri ...
, the emagram is used primarily in Europe
Europe is a continent located entirely in the Northern Hemisphere and mostly in the Eastern Hemisphere. It is bordered by the Arctic Ocean to the north, the Atlantic Ocean to the west, the Mediterranean Sea to the south, and Asia to the east ...
an countries. Other countries use similar thermodynamic diagrams for the same purpose. However, the details of their construction vary. Emagram is the first atmospheric thermodynamic diagram.
See also
*Thermodynamic diagrams
Thermodynamic diagrams are diagrams used to represent the thermodynamic states of a material (typically fluid) and the consequences of manipulating this material. For instance, a temperature–entropy diagram (Temperature–entropy diagram, T–s ...
* Skew-T log-P diagram
*Tephigram
A tephigram is one of a number of thermodynamic diagrams commonly used in weather analysis and forecasting. The name evolved from the original name "T-\phi-gram" to describe the axes of temperature (T) and entropy (\phi) used to create the plo ...
* Stüve diagram
References
Thermodynamic diagrams
Bibliography
* * Atmospheric thermodynamics {{climate-stub