|
Oscillator (technical Analysis)
An oscillator in technical analysis of financial markets is an indicator that informs if the price of a financial instrument is very high or very low, indicating whether it is overbought or oversold. This helps traders make decisions about when to trade (buy or sell) that instrument. Oscillators vary over time within a band, moving above and below a center line or between set levels. They are used to identify short-term overbought or oversold conditions. Examples Common oscillators include MACD, Momentum (technical analysis), momentum, Relative strength index, RSI, and Commodity channel index, CCI. ReferencesIntroduction to Technical Indicators and Oscillators Technical analysis Technical indicators {{finance-stub ... [...More Info...] [...Related Items...] OR: [Wikipedia] [Google] [Baidu] |
|
|
Commodity Channel Index
The commodity channel index (CCI) is an Oscillator_(technical_analysis), oscillator indicator that is used by Trader (finance), traders and investors to help identify Price action trading, price reversals, price extremes and trend strength when using technical analysis to analyse financial markets. History It was originally introduced by Donald Lambert in 1980. Since its introduction, the indicator has grown in popularity and has become a very common tool for traders to identify cyclical trends not only in commodities but also equities and currencies. The CCI can be adjusted to the timeframe of the market traded on by changing the averaging period. Calculation CCI measures a security's variation from the statistical mean. The CCI is calculated as the difference between the typical price of a commodity and its moving average (finance)#Simple moving average , simple moving average, divided by the mean absolute deviation of the typical price. The index is usually scaled by an i ... [...More Info...] [...Related Items...] OR: [Wikipedia] [Google] [Baidu] |
|
 |
Technical Analysis
In finance, technical analysis is an analysis methodology for analysing and forecasting the direction of prices through the study of past market data, primarily price and volume. As a type of active management, it stands in contradiction to much of modern portfolio theory. The efficacy of technical analysis is disputed by the efficient-market hypothesis, which states that stock market prices are essentially unpredictable, and research on whether technical analysis offers any benefit has produced mixed results.Osler, Karen (July 2000). "Support for Resistance: Technical Analysis and Intraday Exchange Rates," FRBNY Economic Policy Reviewabstract and paper here. It is distinguished from fundamental analysis, which considers a company's financial statements, health, and the overall state of the market and economy. History The principles of technical analysis are derived from hundreds of years of financial market data. Some aspects of technical analysis began to appear in Amste ... [...More Info...] [...Related Items...] OR: [Wikipedia] [Google] [Baidu] |
 |
MACD
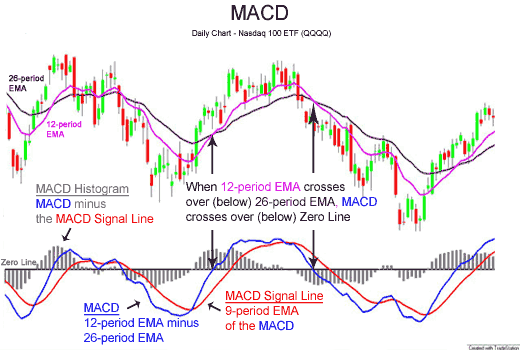
MACD, short for moving average convergence/divergence, is a trading indicator used in technical analysis of securities prices, created by Gerald Appel in the late 1970s. It is designed to reveal changes in the strength, direction, momentum, and duration of a trend in a stock's price. The MACD indicator (or "oscillator") is a collection of three time series calculated from historical price data, most often the closing price. These three series are: the MACD series proper, the "signal" or "average" series, and the "divergence" series which is the difference between the two. The MACD series is the difference between a "fast" (short period) exponential moving average (EMA), and a "slow" (longer period) EMA of the price series. The average series is an EMA of the MACD series itself. The MACD indicator thus depends on three time parameters, namely the time constants of the three EMAs. The notation "MACD(''a'',''b'',''c'')" usually denotes the indicator where the MACD series is the ... [...More Info...] [...Related Items...] OR: [Wikipedia] [Google] [Baidu] |
|
Momentum (technical Analysis)
In financial technical analysis, momentum (MTM) and rate of change (ROC) are simple Technical indicator, indicators showing the difference between today's closing price and the close N days ago. Momentum is the absolute difference in stock, commodity: : \text = \text_\text - \text_ Rate of change scales by the old close, so as to represent the increase as a fraction, : \text = ''"Momentum"'' in general refers to prices continuing to trend. The momentum and ROC indicators show trend by remaining positive while an uptrend is sustained, or negative while a downtrend is sustained. A crossing up through zero may be used as a signal to buy, or a crossing down through zero as a signal to sell. How high (or how low when negative) the indicators get shows how strong the trend is. The way momentum shows an absolute change means it shows for instance a $3 rise over 20 days, whereas ROC might show that as 0.25 for a 25% rise over the same period. One can choose between looking at a m ... [...More Info...] [...Related Items...] OR: [Wikipedia] [Google] [Baidu] |
|
 |
Relative Strength Index
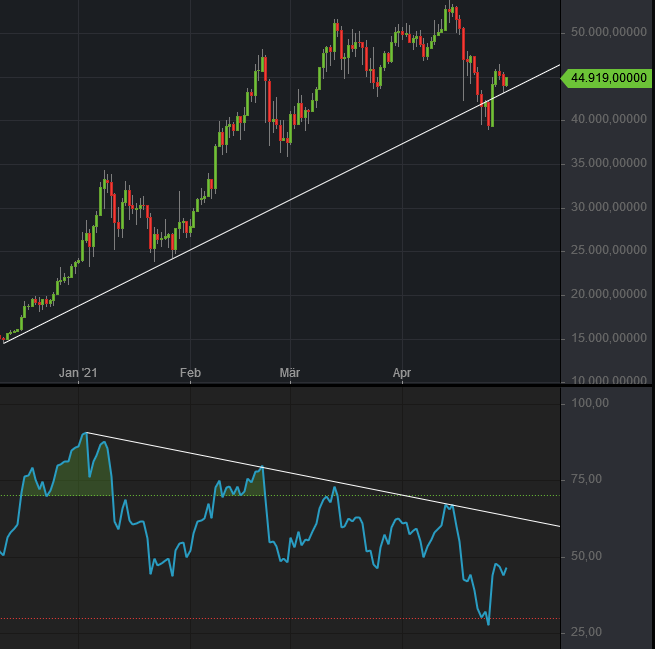
The relative strength index (RSI) is a technical indicator used in the analysis of financial markets. It is intended to chart the current and historical strength or weakness of a stock or market based on the closing prices of a recent trading period. The indicator should not be confused with relative strength. The RSI is classified as a momentum oscillator, measuring the velocity and magnitude of price movements. Momentum is the rate of the rise or fall in price. The relative strength RS is given as the ratio of higher closes to lower closes. Concretely, one computes two averages of absolute values of closing price changes, i.e. two sums involving the sizes of candles in a candle chart. The RSI computes momentum as the ratio of higher closes to overall closes: stocks which have had more or stronger positive changes have a higher RSI than stocks which have had more or stronger negative changes. The RSI is most typically used on a 14-day timeframe, measured on a scale from 0 to 10 ... [...More Info...] [...Related Items...] OR: [Wikipedia] [Google] [Baidu] |
|
Technical Analysis
In finance, technical analysis is an analysis methodology for analysing and forecasting the direction of prices through the study of past market data, primarily price and volume. As a type of active management, it stands in contradiction to much of modern portfolio theory. The efficacy of technical analysis is disputed by the efficient-market hypothesis, which states that stock market prices are essentially unpredictable, and research on whether technical analysis offers any benefit has produced mixed results.Osler, Karen (July 2000). "Support for Resistance: Technical Analysis and Intraday Exchange Rates," FRBNY Economic Policy Reviewabstract and paper here. It is distinguished from fundamental analysis, which considers a company's financial statements, health, and the overall state of the market and economy. History The principles of technical analysis are derived from hundreds of years of financial market data. Some aspects of technical analysis began to appear in Amste ... [...More Info...] [...Related Items...] OR: [Wikipedia] [Google] [Baidu] |