|
Cartogram
A cartogram (also called a value-area map or an anamorphic map, the latter common among German-speakers) is a thematic map of a set of features (countries, provinces, etc.), in which their geographic size is altered to be directly proportional to a selected ratio-level variable, such as travel time, population, or GNP. Geographic space itself is thus warped, sometimes extremely, in order to visualize the distribution of the variable. It is one of the most abstract types of map; in fact, some forms may more properly be called diagrams. They are primarily used to display emphasis and for analysis as nomographs. Cartograms leverage the fact that size is the most intuitive visual variable for representing a total amount.Jacque Bertin, ''Sémiologie Graphique. Les diagrammes, les réseaux, les cartes''. With Marc Barbut t al. Paris : Gauthier-Villars. ''Semiology of Graphics'', English Edition, Translation by William J. Berg, University of Wisconsin Press, 1983.) In this, it i ... [...More Info...] [...Related Items...] OR: [Wikipedia] [Google] [Baidu] |
Pierre Émile Levasseur
Pierre Émile Levasseur, 3rd Baron Levasseur (8 December 1828 – 10 July 1911), was a French economist, historian, Professor of geography, history and statistics in the Collège de France, at the Conservatoire national des arts et métiers and at the École Libre des Sciences Politiques, known as one of the founders and promoters of the study of commercial geography. Life and work Levasseur was born in Paris, France, as son of the jewelry manufacturer Pierre Antoine Levasseur. He was educated at the École Normale Supérieure in Paris. Levasseur began teaching in the lycée at Alençon in 1852, and in 1857 became professor of rhetoric at Besançon. He returned to Paris to become professor at the lycée Saint Louis. In 1868 he was chosen a member of the Academy of Moral and Political Sciences. In 1872 he was appointed professor of geography, history and statistics in the College de France, and subsequently became also professor at the ''Conservatoire des arts et métiers'' and ... [...More Info...] [...Related Items...] OR: [Wikipedia] [Google] [Baidu] |
Visual Variable
A visual variable, in cartographic design, graphic design, and data visualization, is an aspect of a graphical object that can visually differentiate it from other objects, and can be controlled during the design process. The concept was first systematized by Jacques Bertin, a French cartographer and graphic designer, and published in his 1967 book, ''Sémiologie Graphique.''Jacque Bertin, ''Sémiologie Graphique. Les diagrammes, les réseaux, les cartes''. With Marc Barbut t al. Paris : Gauthier-Villars. ''Semiology of Graphics'', English Edition, Translation by William J. Berg, University of Wisconsin Press, 1983.) Bertin identified a basic set of these variables and provided guidance for their usage; the concept and the set of variables has since been expanded, especially in cartography, where it has become a core principle of education and practice.Roth, Robert EVisual Variables in D. Richardson, N. Castree, M.F. Goodchild, A. Kobayashki, W. Liu, and R.A. Marston, eds. ''The Int ... [...More Info...] [...Related Items...] OR: [Wikipedia] [Google] [Baidu] |
Thematic Map
A thematic map is a type of map that portrays the geographic pattern of a particular subject matter (theme) in a geographic area. This usually involves the use of map symbols to visualize selected properties of geographic features that are not naturally visible, such as temperature, language, or population. In this, they contrast with general reference maps, which focus on the location (more than the properties) of a diverse set of physical features, such as rivers, roads, and buildings. Alternative names have been suggested for this class, such as ''special-subject'' or ''special-purpose maps'', ''statistical maps'', or ''distribution maps'', but these have generally fallen out of common usage. Thematic mapping is closely allied with the field of Geovisualization. Several types of thematic maps have been invented, starting in the 18th and 19th centuries, as large amounts of statistical data began to be collected and published, such as national censuses. These types, such a ... [...More Info...] [...Related Items...] OR: [Wikipedia] [Google] [Baidu] |
Proportional Symbol Map
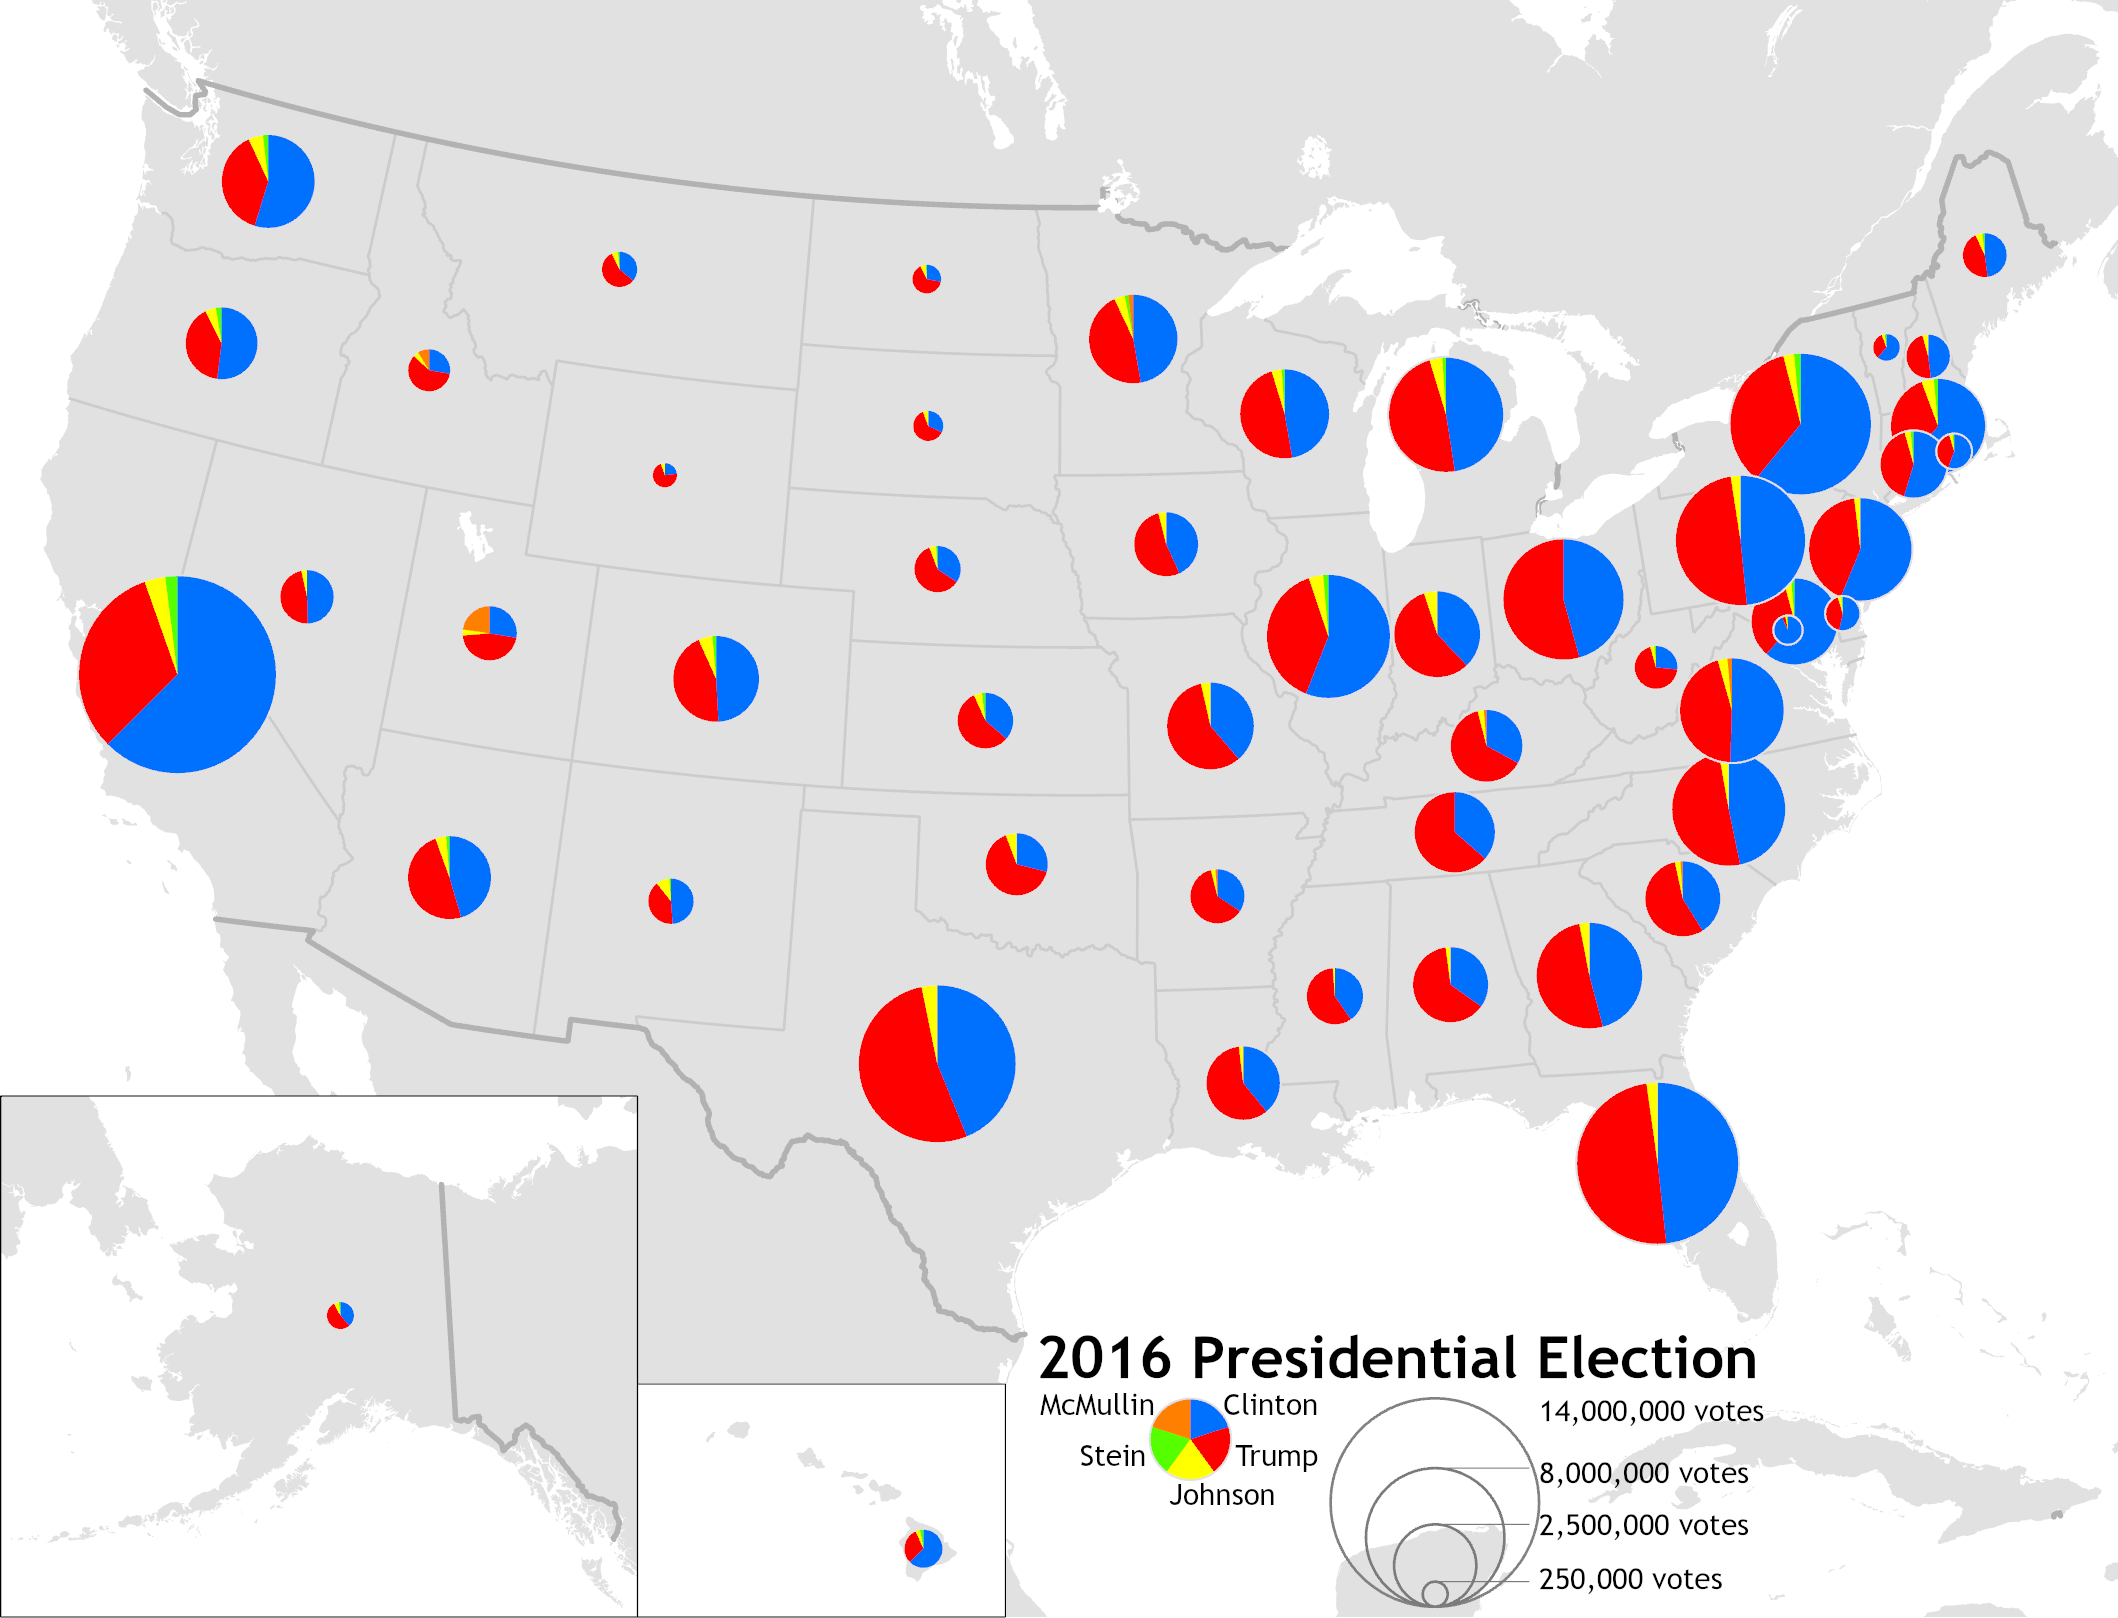
A proportional symbol map or proportional point symbol map is a type of thematic map that uses map symbols that vary in size to represent a quantitative variable. For example, circles may be used to show the location of cities within the map, with the size of each circle sized proportionally to the population of the city. Typically, the size of each symbol is calculated so that its area is mathematically proportional to the variable, but more indirect methods (e.g., categorizing symbols as "small," "medium," and "large") are also used. While all dimensions of geometric primitives (i.e., points, lines, and regions) on a map can be resized according to a variable, this term is generally only applied to point symbols, and different design techniques are used for other dimensionalities. A cartogram is a map that distorts region size proportionally, while a flow map represents lines, often using the width of the symbol (a form of size) to represent a quantitative variable. That said, ... [...More Info...] [...Related Items...] OR: [Wikipedia] [Google] [Baidu] |
Map Symbol
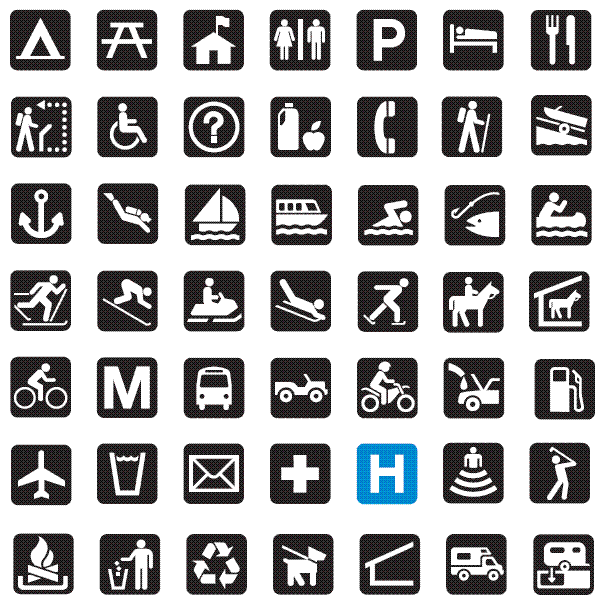
A map symbol or cartographic symbol is a graphical device used to visually represent a real-world feature on a map, working in the same fashion as other forms of symbols. Map symbols may include point markers, lines, regions, continuous fields, or text; these can be designed visually in their shape, size, color, pattern, and other graphic variables to represent a variety of information about each phenomenon being represented. Map symbols simultaneously serve several purposes: * Declare the existence of geographic phenomena * Show location and extent * Visualize attribute information * Add to (or detract from) the aesthetic appeal of the map, and/or evoke a particular aesthetic reaction (a "look and feel") * Establish an overall gestalt order to make the map more or less useful, including visual hierarchy Representing spatial phenomena Symbols are used to represent geographic phenomena, which exist in, and are represented by, a variety of spatial forms. Different kinds of symb ... [...More Info...] [...Related Items...] OR: [Wikipedia] [Google] [Baidu] |
Flow Map
A flow map is a type of thematic map that uses linear symbols to represent movement. It may thus be considered a hybrid of a map and a flow diagram. The movement being mapped may be that of anything, including people, highway traffic, trade goods, water, ideas, telecommunications data, etc. The wide variety of moving material, and the variety of geographic networks through they move, has led to many different design strategies. Some cartographers have expanded this term to any thematic map of a linear network, while others restrict its use to maps that specifically show movement of some kind. Many flow maps use line width proportional to the amount of flow, making them similar to other maps that use proportional size, including cartograms (altering region area), and proportional point symbols. History The earliest known map to visually represent the volume of flow were two maps by engineer Henry Drury Harness, published in 1838 as part of a report on the potential for railr ... [...More Info...] [...Related Items...] OR: [Wikipedia] [Google] [Baidu] |
Choropleth Map
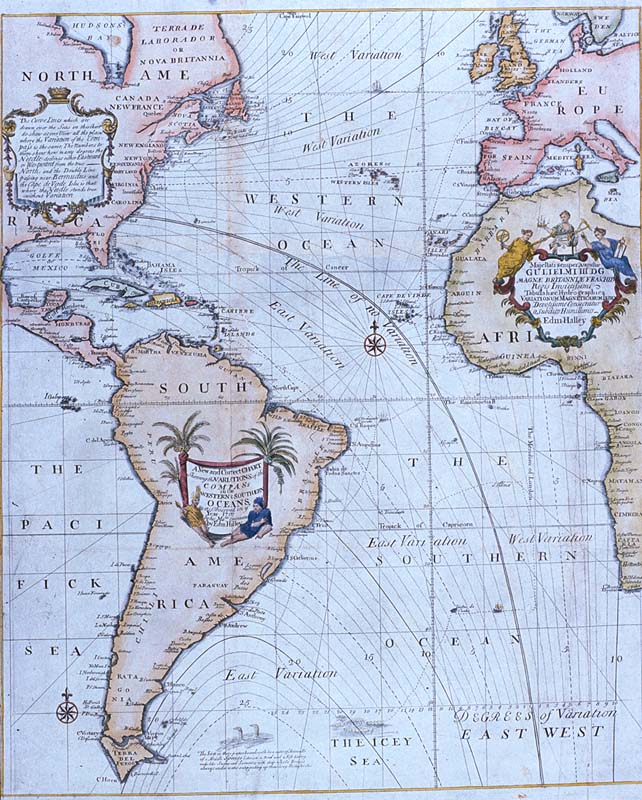
A choropleth map () is a type of statistical thematic map that uses pseudocolor, i.e., color corresponding with an aggregate summary of a geographic characteristic within spatial enumeration units, such as population density or per-capita income. Choropleth maps provide an easy way to visualize how a variable varies across a geographic area or show the level of variability within a region. A heat map or isarithmic map is similar but uses regions drawn according to the pattern of the variable, rather than the '' a priori'' geographic areas of choropleth maps. The choropleth is likely the most common type of thematic map because published statistical data (from government or other sources) is generally aggregated into well-known geographic units, such as countries, states, provinces, and counties, and thus they are relatively easy to create using GIS, spreadsheets, or other software tools. History The earliest known choropleth map was created in 1826 by Baron Pierre Charl ... [...More Info...] [...Related Items...] OR: [Wikipedia] [Google] [Baidu] |
Journal Of Geography
The ''Journal of Geography'' is an American academic journal published by the National Council for Geographic Education. The journal "publishes research, instructional approaches and book reviews on innovative approaches to geography research, teaching, and learning." The editor in chief, is Meredith Marsh of Lindenwood University, USA It has an Impact factor of 1.262 for 2019 References Geography journals Publications established in 1902 {{geography-journal-stub ... [...More Info...] [...Related Items...] OR: [Wikipedia] [Google] [Baidu] |
Erwin Raisz
Erwin Raisz (1 March 1893, Lőcse, Hungary – 1 December 1968, Bangkok, Thailand) was a Hungary, Hungarian-born American cartographer, best known for his Physical geography, physiographic maps of landforms. Early life and education Born in Lőcse, Hungary (now part of Slovakia) in 1893, Raisz was the son of a civil engineer who introduced him to maps through his work. He received his degree in civil engineering and architecture from the Budapest University of Technology and Economics (Royal Polytechnicum) in Budapest in 1914. Career Raisz served in the army during World War I, and emigrated to New York in 1923. He worked for the Ohman Map Company while studying for his 1929 Ph.D. at Columbia University. He offered a course in cartography while a student, one of the first such in the United States. In 1931 he joined the Institute of Geographical Exploration at Harvard University, where he taught cartography and was curator of the map collection for 20 years. He created a signi ... [...More Info...] [...Related Items...] OR: [Wikipedia] [Google] [Baidu] |
Centre Party (Germany)
The Centre Party (german: Zentrum), officially the German Centre Party (german: link=no, Deutsche Zentrumspartei) and also known in English as the Catholic Centre Party, is a Catholic political party in Germany, influential in the German Empire and Weimar Republic. It is the oldest German political party to be still in existence since its founding date. Formed in 1870, it successfully battled the '' Kulturkampf'' waged by Chancellor Otto von Bismarck against the Catholic Church. It soon won a quarter of the seats in the Reichstag (Imperial Parliament), and its middle position on most issues allowed it to play a decisive role in the formation of majorities. The party name ''Zentrum'' (Centre) originally came from the fact Catholic representatives would take up the middle section of seats in parliament between social democrats and conservatives. For most of the Weimar Republic, the Centre Party was the third-largest party in the Reichstag and a bulwark of the Republic, participat ... [...More Info...] [...Related Items...] OR: [Wikipedia] [Google] [Baidu] |
Waldo R
Waldo may refer to: People * Waldo (given name), a list of people and fictional characters * Waldo (surname), a list of people * Waldo (footballer) (1934-2019), full name Waldo Machado da Silva, Brazilian footballer Places Canada * Waldo, British Columbia, a ghost town United States Inhabited places * Waldo, Alabama, a town * Waldo, Arkansas, a city * Waldo, former name of Sausalito, California, a city * Waldo Junction, California, formerly Waldo, an unincorporated community * Waldo, Florida, a city ** Waldo Historic District, Waldo, Florida * Waldo, Kansas, a small town ** Waldo Township, Russell County, Kansas, the surrounding township * Waldo, Kansas City, Missouri, a city neighborhood * Waldo, Magoffin County, Kentucky * Waldo County, Maine ** Waldo, Maine, a town * Waldo, Missouri, an unincorporated community * Waldo, New Mexico, an unincorporated area * Waldo, Ohio, a village ** Waldo Township, Marion County, Ohio, the surrounding township * Waldo, Oregon ... [...More Info...] [...Related Items...] OR: [Wikipedia] [Google] [Baidu] |


.png)


