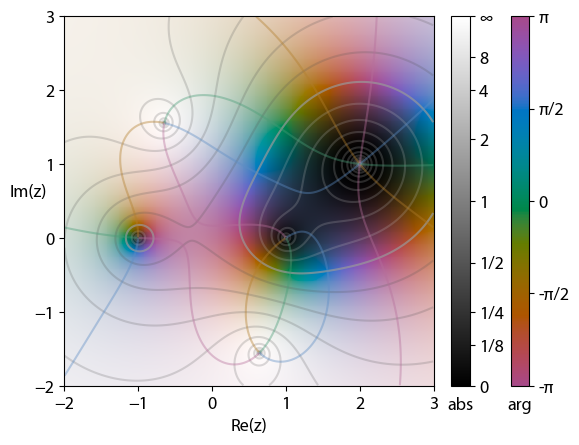
In
complex analysis
Complex analysis, traditionally known as the theory of functions of a complex variable, is the branch of mathematical analysis that investigates functions of complex numbers. It is helpful in many branches of mathematics, including algebraic ...
, domain coloring or a color wheel graph is a technique for
visualizing complex function
Complex analysis, traditionally known as the theory of functions of a complex variable, is the branch of mathematical analysis that investigates functions of complex numbers. It is helpful in many branches of mathematics, including algebraic g ...
s by assigning a
color
Color (or colour in English in the Commonwealth of Nations, Commonwealth English; American and British English spelling differences#-our, -or, see spelling differences) is the visual perception based on the electromagnetic spectrum. Though co ...
to each point of the
complex plane
In mathematics, the complex plane is the plane (geometry), plane formed by the complex numbers, with a Cartesian coordinate system such that the horizontal -axis, called the real axis, is formed by the real numbers, and the vertical -axis, call ...
. By assigning points on the complex plane to different colors and brightness, domain coloring allows for a function from the complex plane to itself, whose graph would normally require four spatial dimensions, to be easily represented and understood. This provides insight to the fluidity of complex functions and shows natural geometric extensions of
real function
In mathematical analysis, and applications in geometry, applied mathematics, engineering, and natural sciences, a function of a real variable is a function whose domain is the real numbers \mathbb, or a subset of \mathbb that contains an inter ...
s.
Motivation
A
graph of a
real function
In mathematical analysis, and applications in geometry, applied mathematics, engineering, and natural sciences, a function of a real variable is a function whose domain is the real numbers \mathbb, or a subset of \mathbb that contains an inter ...
can be drawn in two dimensions because there are two represented variables,
and
. However,
complex number
In mathematics, a complex number is an element of a number system that extends the real numbers with a specific element denoted , called the imaginary unit and satisfying the equation i^= -1; every complex number can be expressed in the for ...
s are represented by two variables and therefore two dimensions; this means that representing a complex function (more precisely, a
complex-valued function of one
complex variable ) requires the visualization of four dimensions. One way to achieve that is with a
Riemann surface
In mathematics, particularly in complex analysis, a Riemann surface is a connected one-dimensional complex manifold. These surfaces were first studied by and are named after Bernhard Riemann. Riemann surfaces can be thought of as deformed vers ...
, but another method is by domain coloring.
History
The term "domain coloring" was coined by Frank Farris, possibly around 1998.
[ Lundmark refers to Farris' coining the term "domain coloring" in this 2004 article.] There were many earlier uses of color to visualize complex functions, typically mapping
argument
An argument is a series of sentences, statements, or propositions some of which are called premises and one is the conclusion. The purpose of an argument is to give reasons for one's conclusion via justification, explanation, and/or persu ...
(
phase) to hue.
Larry Crone used the method in the late 1980s.
Dan Kucerovsky used it in 1990. The technique of using continuous color to map points from domain to codomain or image plane was used in 1999 by George Abdo and Paul Godfrey
and colored grids were used in graphics by
Doug Arnold that he dates to 1997.
Method
Representing a four dimensional complex mapping with only two variables is undesirable, as methods like projections can result in a loss of information. However, it is possible to add variables that keep the four-dimensional process without requiring a visualization of four dimensions. In this case, the two added variables are visual inputs such as color and brightness because they are naturally two variables easily processed and distinguished by the human eye. This assignment is called a "color function". There are many different color functions used. A common practice is to represent the
complex argument,
, (also known as "phase" or "angle") with a
hue following the
color wheel
A color wheel or color circle is an abstract illustrative organization of color hues around a circle, which shows the relationships between primary colors, secondary colors, tertiary colors etc.
Some sources use the terms ''color wheel'' an ...
, and the
magnitude by other means, such as
brightness
Brightness is an attribute of visual perception in which a source appears to be radiating/reflecting light. In other words, brightness is the perception dictated by the luminance of a visual target. The perception is not linear to luminance, and ...
or
saturation.
Simple color function
The following example colors the
origin in black, in
green
Green is the color between cyan and yellow on the visible spectrum. It is evoked by light which has a dominant wavelength of roughly 495570 nm. In subtractive color systems, used in painting and color printing, it is created by a com ...
, in
magenta
Magenta () is a purple-red color. On color wheels of the RGB color model, RGB (additive) and subtractive color, CMY (subtractive) color models, it is located precisely midway between blue and red. It is one of the four colors of ink used in colo ...
, and a point at infinity in white:
Where H is
hue, S is
saturation, and L is
lightness.
There are a number of choices for the function
 In
In  In
In